In 2013, a series of floods ravaged Colorado—including the city of Loveland, which lies about 50 miles north of Denver. Flooding there razed the Idylwilde Dam, which generated hydropower for the city. This forced officials to rethink how they could produce electricity.
Using a grant from the Federal Emergency Management Administration’s (FEMA) Alternate Project funds, Loveland ended up replacing its hydroelectric power source with a solar field. By the end of 2016, the Foothills Solar and Substation project had more than 10,000 solar panels up and running, producing 3.5 megawatts of electricity—over three times the capacity of the dam’s 900 kilowatts. That’s reportedly enough to power 574 homes in Colorado for an entire year.
The City of Loveland needed a way to manage all the assets in its new solar facility—preferably in a repeatable and efficient manner. The Water and Power Department wanted to be able to track not only assets but also maintenance schedules and all the costs associated with that. This would include everything from mowing the grass and cleaning the photovoltaic panels to replacing inverter air filters and inspecting the motors that enable the panels to track the sun. Additionally, the Water and Power Department wanted to use the city’s existing Cityworks asset management system from Esri partner Azteca Systems, LLC, since a number of other departments also use it for maintenance management and work order tracking.

To meet all these requirements, staff decided that employing a schema and organizing the assets into features in ArcGIS would be the best way to do this. But that would mean that every single component of the solar field would have to have a feature and/or related asset record in ArcGIS. That was going to be a big project.
Initially, the Water and Power Department tried to find an already-existing asset-driven data model or related database schema for solar fields. After scouring the Internet and contacting several organizations—including Esri, the National Renewable Energy Laboratory, Colorado State University (which has a solar facility), multiple solar construction companies, and other municipal agencies—to get input, staff realized that Loveland’s project was unique. There were many examples of data models and schemas being used for solar site selection, but it seemed that nobody was actively employing Esri technology alongside Cityworks to manage assets in a solar facility. The city was going to have to build its own data model from scratch.
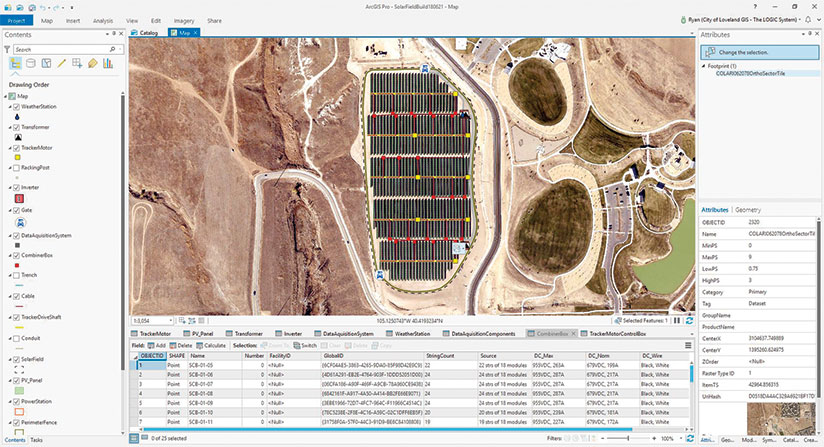
It took the Water and Power Department three months to create and start using the asset data model. First, the small team working on the project used ArcGIS Pro 2.2 to convert CAD drawings of the solar field into feature classes. Then the team took city-owned aerial photography and used the conflation tools in ArcGIS Pro to ensure that the CAD drawings matched the images. The team also went out in the field with Collector for ArcGIS to give each piece of equipment a unique ID and verify that nothing went missing during the CAD conversion. All this data was stored in the city’s existing Microsoft SQL Server geodatabase.
Once the data model was deployed, the Water and Power Department built the work order requirements and their related workflows in Cityworks. Finally, staff were able to attach work orders to specific assets.

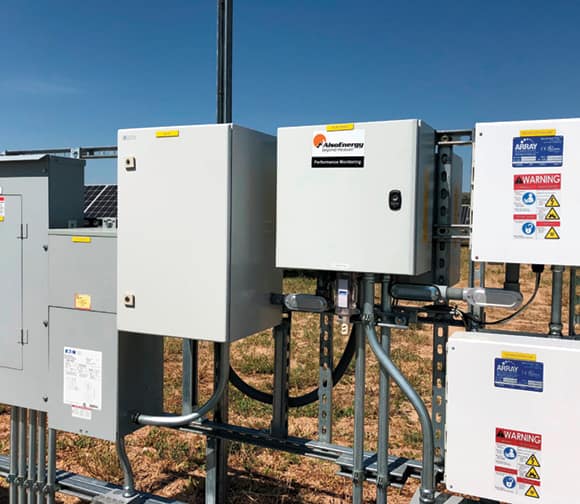
Now, every single asset in the facility—from combiner boxes and track motors to inverters and transformers—is stored in this system of record, which staff also use to keep track of maintenance schedules, including the time it takes to perform maintenance, how much time passes between repairs, and how long each asset has been in use. This allows the Water and Power Department to conduct more preventive and lower-cost maintenance as opposed to always having to replace pieces of equipment.
Additionally, with Cityworks mobile, field crews can take asset management requests and perform maintenance in the field—all from their mobile devices. Because the entire data model was built in ArcGIS Pro, field staff can make their edits quickly and precisely, too.
The City of Loveland has been using Cityworks, ArcGIS Pro, and the data model to monitor and manage assets in its new solar field since May—and staff are impressed by the results. Because each work order contains detailed information about associated equipment and assets, including costs, the city can manage warehouse materials, stock levels, and spare parts more accurately and efficiently.
“As we begin tracking historical data, we can better understand each job and its associated cost,” said Sterling Overturf, a business analyst at the City of Loveland. “This is impressive in itself and helps us better manage our equipment and staff time—and it will lead to better management of the facility overall.”
In the future, the City of Loveland intends to expand its solar data model alongside any augmentations of the solar field, so it can seamlessly handle additional assets and their maintenance, upgrade, and replacement schedules. This way, the Foothills Solar and Substation project can keep powering a growing Loveland for years to come.
For more information on Loveland’s solar field asset management project, contact senior GIS specialist Ryan Smith at ryan.smith@cityofloveland.org or 970-962-3599.


