The earth’s surface is in a constant state of change, and one reason for this is land subsidence. More than just a reason for localized sinkholes, land subsidence can cause entire agricultural areas, river deltas, and even urban areas to sink.
A global problem with far-reaching effects, land subsidence is caused by a range of factors, including mining activities, water saturation of sandy soil, soil compaction, and thawing permafrost. Exacerbated by factors ranging from drought to sea level rise, land subsidence can damage roads, building foundations, and subsurface infrastructure such as water and wastewater pipes and utility conduits.
In the United States and many other countries, groundwater extraction is often the main culprit. According to the US Geological Survey, long-term pumping of groundwater for irrigation and other purposes accounts for more than 80 percent of land subsidence throughout the country.
To help detect and analyze land subsidence, researchers are using ArcGIS Image for ArcGIS Online to host the bulk of radar satellite images.
More than Nine Feet in 60 Years
Located in southeastern Arizona, the Willcox Groundwater Basin extends across more than 1,900 square miles, mostly in Cochise County. With depths of up to about 5,000 feet (1,524 meters), the aquifer that underlies the basin provides irrigation water for municipal, agricultural, residential, and livestock uses. According to the Arizona Department of Water Resources, agriculture in the basin contributes significantly to regional and state economies. For example, Cochise County produces almost all of Arizona’s pistachios. Other common crops grown in the basin include alfalfa, corn, and cotton.
Tom Buschatzke, director of the Arizona Department of Water Resources, said water extraction has caused the aquifer’s water levels to drop up to seven feet (about two meters) per year for the past several years.

It’s no coincidence that the Willcox Groundwater Basin has undergone the most land subsidence in Arizona, according to Dr. Danielle Smilovsky, a researcher in Texas State University’s Department of Geography and Environmental Studies. Smilovsky said parts of the basin have dropped more than nine feet during the past 60 years due to groundwater pumping.
“In some cases,” Smilovsky said, “water wells have gone completely dry, and earth fissures caused by land subsidence extend as far as 42 miles within the basin. The natural recharging of the aquifer has also been impacted by climate change and the resulting drought. It provides a stark example of the conflict associated with the ongoing need for water amid a time of dwindling water resources.”
Detecting and Analyzing Land Subsidence
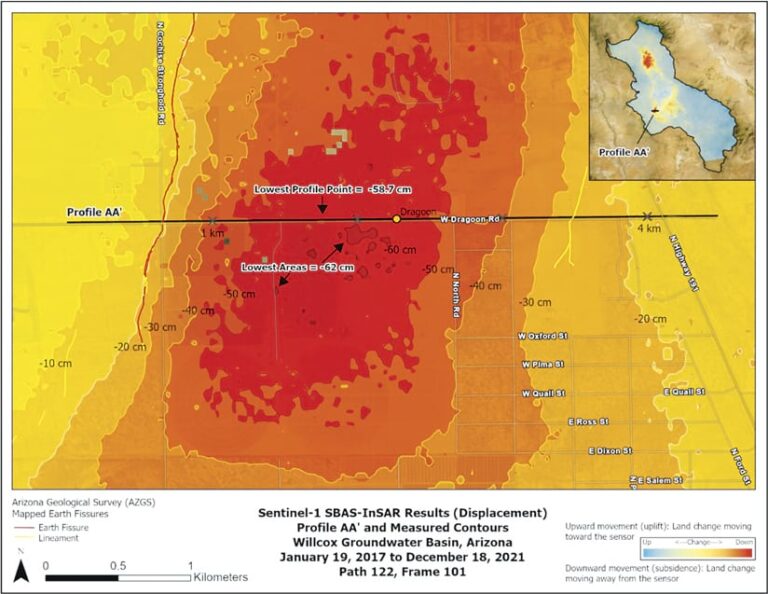
Smilovsky used ArcGIS Image for ArcGIS Online to host her satellite-based image results generated from interferometric synthetic aperture radar (InSAR) to detect and analyze land subsidence in the Willcox Groundwater Basin. The resultant imagery provides unique visualizations of ground-level change, which helps scientists better understand the complexity and impact of land subsidence. With ArcGIS Image Online, Smilovsky can group the images by different spatiotemporal resolutions, apply symbology and raster classifications to each collection, and extract cross-sectional profiles.
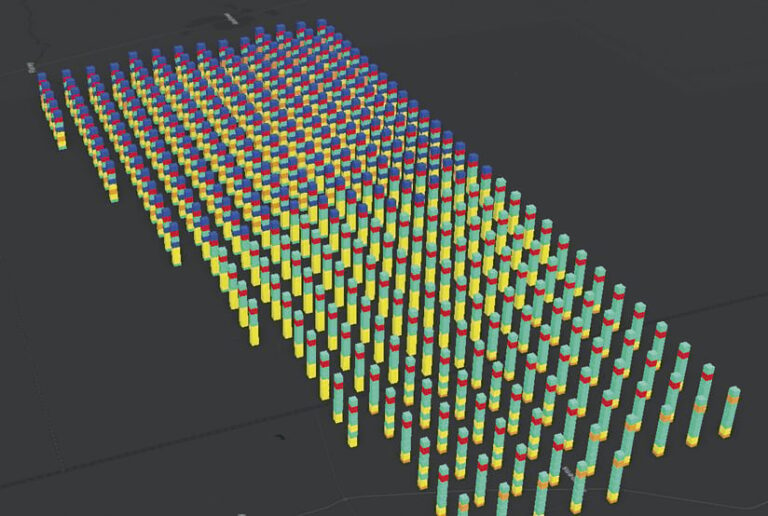
ArcGIS Pro was also used for deformation modeling and mapping, including optimized hot spot analyses. This tracked clusters of deformations and determined where land changes corresponded with water extraction wells and earth fissures. Smilovsky also created space-time cubes, which show how phenomena change over time within geographic space, to visualize land disturbances over time in 3D.
To develop the space-time cubes, a centroid point for each pixel was applied to each InSAR deformation raster on a quarterly basis, Smilovsky said. “This was repeated 20 times to essentially build pillars of deformation values for each pixel across time and space,” she said. “These cubes are also interactive, so you can toggle different time periods on and off to examine them more carefully.”

Helping with Mitigation Plans
The space-time cubes show how Willcox Groundwater Basin subsidence continues to expand and provides insight into future land degradation. This helps decision-makers when considering mitigation efforts, such as reduced groundwater pumping, to slow the process, and potentially reverse its harmful effects.
“The analytic and visual capabilities of ArcGIS allow us to tell a compelling story about land deformation in the Willcox Groundwater Basin,” Smilovsky said. “The resulting maps and charts from the collected data can be included in reports and presentations to inform decision-makers about the urgency of groundwater depletion in the basin. This will hopefully raise more awareness and encourage corrective action.”

