The state of Queensland, in northeastern Australia, is remarkably geographically diverse. It includes coastal rain forests, widespread eucalypt and acacia woodlands, tropical savannas, ephemeral inland rivers, deserts, and rich agricultural belts. With an area of 1,730,000 square kilometers (668,000 square miles), it is approximately seven times the size of Great Britain.
To map and assess land-use patterns and changes throughout the state, Queensland’s Department of Environment and Science (DES) formed the Queensland Land Use Mapping Program (QLUMP) more than 20 years ago.

“Land use has been identified as a foundational spatial dataset that the government considers vital for the progression and development of Queensland,” said Andy Clark, senior scientist at the DES Remote Sensing Centre. “The state is large, and it is important that we continue to improve the speed at which we collect this data, as well as its accuracy. In addition, we must keep our procedures in accordance with the standards established by the Australian Land Use and Management Classification system so that it is consistent with data collected throughout the entire country.”
Traditionally, the methodology used to keep QLUMP up-to-date relied on a team of skilled spatial scientists to manually digitize land-use features from satellite imagery. Because of the size of Queensland, this process took a lot of time and resources.
“Previously, we have made various attempts to automate QLUMP, all of which ultimately proved to be unsuccessful,” said Clark. “Decision tree models were used to infer land-use features from ancillary data; however, this method did not provide an accurate representation of what was on the ground. We tried using the spectral information from satellite imagery to conduct a supervised classification but determined that this procedure could not successfully distinguish between features because, spectrally, they appear very similar. Also, object-based image analyses tended to be just as resource-intensive as manually drawing land-use features.”
Computer vision in fusion with high-performance supercomputing and integrated with ArcGIS represents a paradigm shift that increases our capacity to compile and publish timely land-use information.
In recent years, however, machine learning—a subdiscipline of artificial intelligence (AI)—has progressed to the point that using computer vision and deep learning in image analysis and classification is now viable.
“With advanced programming tools and computer hardware, the speed and capabilities required to successfully apply machine learning to accurately classify large areas of land looks very promising,” said Clark.
In fact, he and his team developed a model that can automatically classify different types of land use throughout Queensland. Here’s how they got it working.
Refining the Data and Training the Process
It requires a lot of information to train a model to do machine learning. Fortunately for DES, it had been using QLUMP for years to collect data.
“It was just a matter of refining it so that it could be used in the machine learning process,” said Clark.

He used ArcGIS Pro and ArcPy to generate and refine the training data. Clark also applied a range of geoprocessing tools to postprocess the prediction probability from the computer vision model.
“[The] Reclassify [tool was] used to convert the prediction to a binary raster,” he explained. “Raster to Polygon [was used] to convert the data to a feature class. Union [was used] to derive change. And Eliminate [was used] to merge small features into larger ones.”
The QLUMP team independently verified the accuracy of the process by randomly generating thousands of points and assessing the land use at each point.
“ArcGIS Pro also generates the error matrix for us, as well as the creation and publication of web maps, apps, and reports to communicate with our stakeholders,” Clark added.
In the machine learning process, DES uses a convolutional neural network (CNN) based on a U-net architecture to help the model visually recognize land cover. CNNs are algorithms that mimic the functions of the human brain. By being exposed to large amounts of visual data, the model can learn to distinguish between similarities and dissimilarities in the data.
“We borrowed the idea from Olaf Ronneberger, who developed it for biomedical image segmentation, which is a way to identify cells in microscopy images,” Clark explained. “Using this architecture, we created an algorithm with 87,153,153 parameters.”
The team iteratively fed thousands of satellite imagery patches through the neural network to produce a prediction. The algorithm then self-evaluated and refined the prediction, and the cycle was repeated until it ultimately achieved a 97-percent-accuracy rate.

“Python was used to develop the computer vision part of the project,” said Clark. “We used NumPy, a library with a large collection of high-level mathematical functions for Python, to handle the multidimensional array and the Geospatial Data Abstraction Library (GDAL) to read the imagery and convert it to the NumPy array—the format required for the neural network.”
GDAL can then take an output array and convert it back to an image.
“There was a small component of GDAL reading vector data, but ArcGIS Pro was the main tool for processing vectors,” said Clark. “We also used Keras, a Python library, for developing and evaluating deep learning models. TensorFlow ran in the back end. It is an artificial intelligence library for data flow and the creation of large-scale neural networks.”
In machine learning, because of the amount of data that has to be processed and refined quickly and repeatedly, processing speed is critical. That’s why DES is using eight Tesla V100 graphics processing units (GPUs) that are connected to its high-performance computing infrastructure for deep learning data processing.
“The processing speed is amazing,” said Clark. “Each GPU essentially provides us with the equivalent of a year’s worth of conventional CPU processing in about 2.5 days.”
Expanding Machine Learning to Other Land Uses
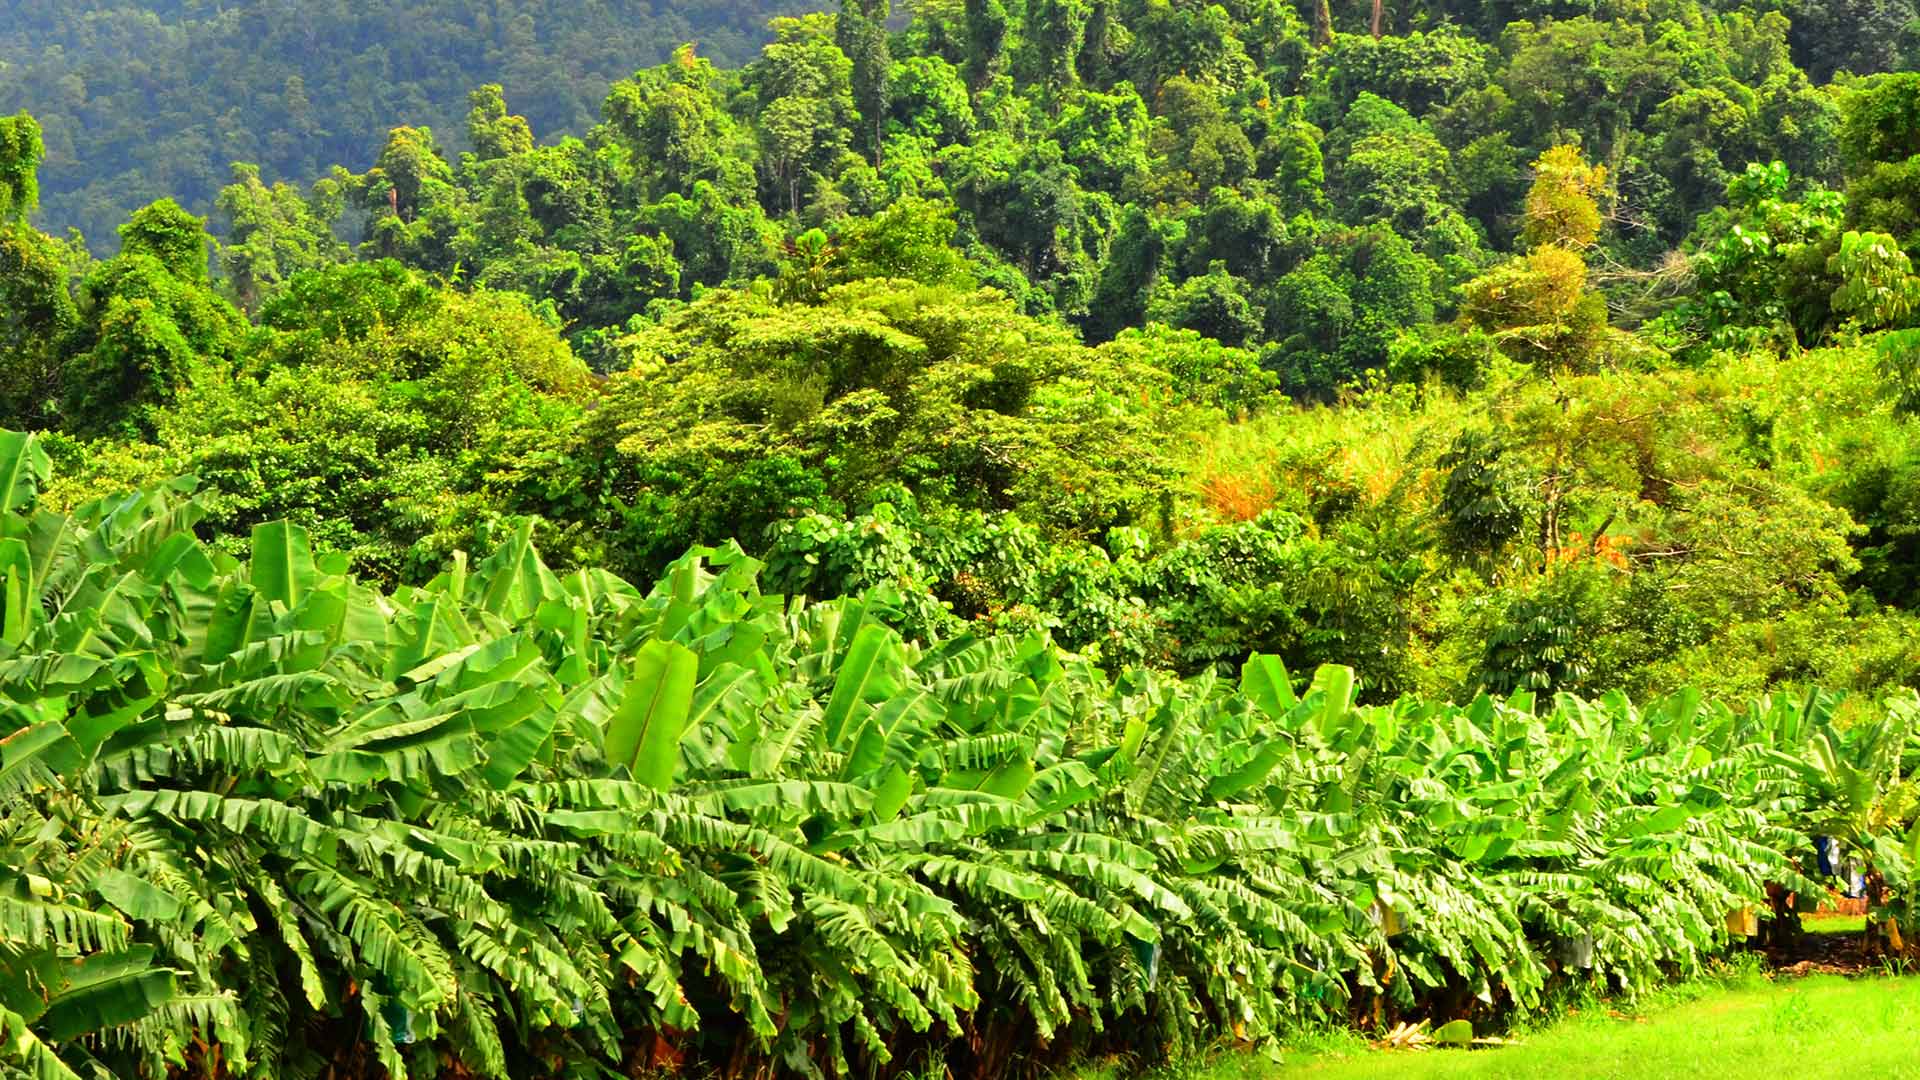
Originally, the model was trained to identify and map banana plantations in the Johnstone River catchment in north Queensland. It was then used to infer banana plantations in the Tully catchment. This allowed the scientists involved in image analysis to focus on the interpretation of the imagery the model produces so they can better inform department decision-makers about appropriate biosecurity responses to plant diseases.
Panama Tropical Race 4 is a serious disease that can spread rapidly through a banana plantation. In 2015, Queensland’s Department of Agriculture and Fisheries (DAF) detected it when examining plant samples.

At the time, DES had not implemented its computer vision-based image analysis process. So determining the potential spread of the pervasive fungus required a team of five scientists per year to manually map and analyze all the banana plantations and other land-use classes in Queensland.
These scientists’ mapping efforts were subsequently used to help train the CNN model. In 2019, DES received new imagery and updated the banana plantation mapping, which took four days for the computer to complete. Because of its speed and accuracy, the CNN model is currently being trained to map other land-use classes.
“Computer vision in fusion with high-performance supercomputing and integrated with ArcGIS represents a paradigm shift that increases our capacity to compile and publish timely land-use information,” said Clark. “The methods are sustainable for any image segmentation task and have been applied to mapping wooded vegetation in Queensland, which is quite a different application, as these areas range from dense rain forest to scattered-tree landscapes.”
DES intends to expand its methods into most land uses, including other crop types, forestry plantations, and urban land-use classes.
“Anything that you can see in the imagery, you can train an algorithm to find. You just need lots of good-quality training data,” said Clark. “Based on the methods developed to date, computer vision has the capability to bring efficiencies to large-area mapping and monitoring programs that inform natural resources management and monitoring by governmental and nongovernmental organizations.”