More than 70 percent of Earth’s surface is open ocean. A significant share of commercial fishing activity happening across that expanse remains invisible to organizations trying to manage it.
Research published in Nature suggests that publicly accessible systems track only about 25 percent of global fishing activity. This leaves the rest essentially unseen. Without this information, regulatory agencies cannot set sustainable catch limits, enforce protected area boundaries, or prosecute illegal fishing.
To help address these issues, new data layers from Global Fishing Watch—an international nonprofit dedicated to ocean transparency—are now available in ArcGIS Online and ArcGIS Living Atlas of the World. These layers give the GIS community its most detailed look yet at vessel movements, fishing patterns, and offshore infrastructure across the world’s oceans.
A Milestone for Marine Data Access
Global Fishing Watch has a straightforward but ambitious mission: to make human activity at sea observable, open, and freely accessible to anyone working to understand or protect the ocean. The organization makes its data available to researchers, policymakers, journalists, and the public—including the growing number of GIS users working on marine conservation, fisheries management, and ocean planning.

While Esri created earlier versions of these layers, Global Fishing Watch has contributed new data. This signals a new level of engagement between the ocean data nonprofit and the Esri community, according to Esri senior principal GIS engineer Keith VanGraafeiland, who helped coordinate the effort to bring the new layers to ArcGIS Living Atlas.
Gaining Deeper Ocean Insight
The new layers bring together four data categories: vessel presence, fishing intensity, and vessel positions that are either known or unreported. Each is designed to illuminate a different dimension of human activity at sea.
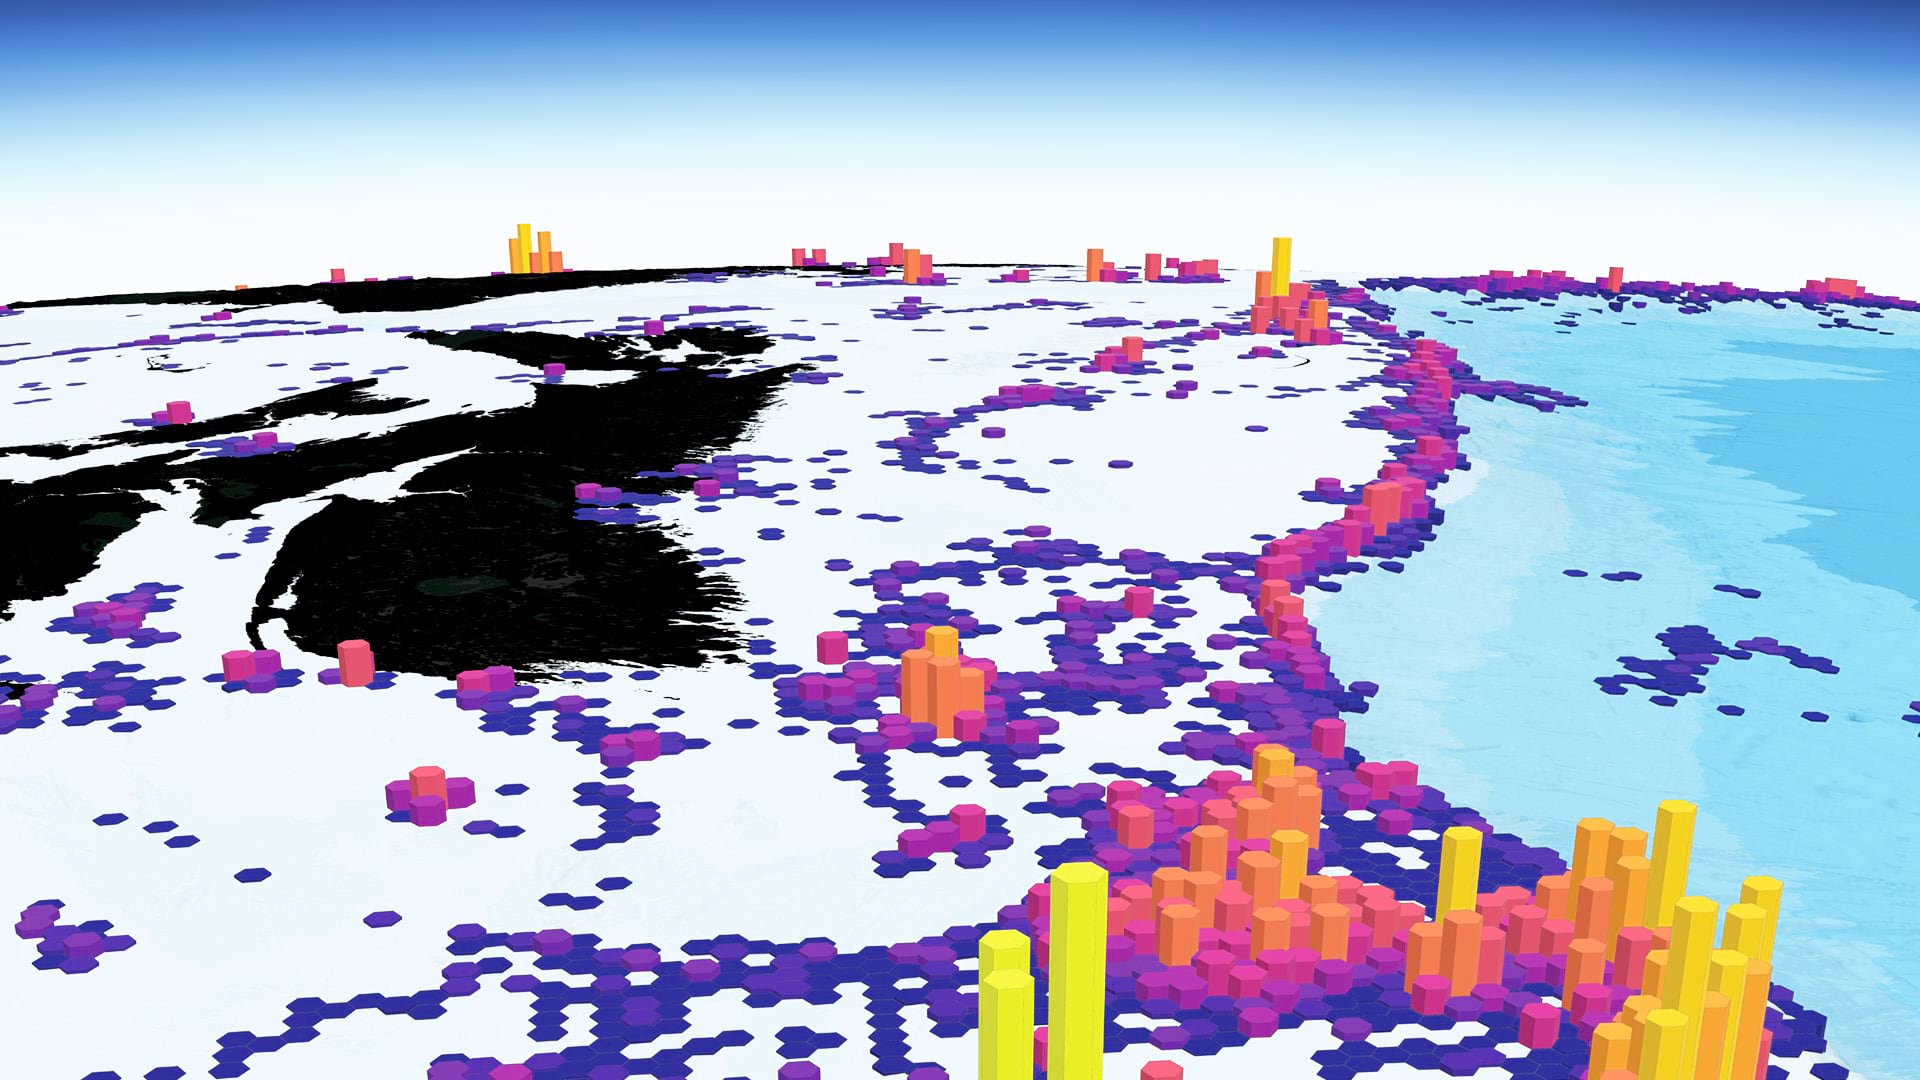
Among the new datasets, Vessel Presence shows where commercial fishing vessels have been detected across the ocean, providing a clear picture of maritime traffic across time and space. A companion dataset, Fishing Effort, visualizes areas where fishing activity is likely occurring, enabling users to track patterns and identify hot spots where pressure on marine ecosystems may be greatest.
Two other layer pairs use satellite-based synthetic aperture radar (SAR)—a remote sensing technology capable of detecting objects on the ocean’s surface regardless of weather conditions or time of day. The SAR Detection Matched layer identifies radar detections that correspond with known vessel positions reported via the Automatic Identification System, a network of terrestrial receivers that monitors the movements and locations of equipped vessels. An accompanying SAR Detection Unmatched layer highlights what analysts call “dark targets”—vessels that do not appear in public monitoring portals even when satellite radar detects them at sea. These unmatched detections may indicate vessels operating without active transponders, a behavior sometimes associated with illegal, unreported, and unregulated fishing.
Rounding out the new release is a fifth layer: SAR Fixed Infrastructure, which maps offshore structures such as oil platforms and wind farms detected by satellite radar. This layer helps planners and regulators monitor the expansion of the offshore industry over time, supporting marine spatial planning at regional and global scales.
Supporting Conservation and Planning
The dark targets that the SAR Detection Unmatched layer reveals sit at the center of one of the oceans’ most persistent governance problems: illegal, unreported, and unregulated fishing.
The Food and Agriculture Organization of the United Nations identifies this as one of the greatest threats to ocean health and coastal livelihoods worldwide. Global fishing demand has grown steadily for decades—averaging 3 percent annually since 1961, according to the organization—placing increasing strain on stocks and ecosystems already under pressure from activity that monitoring systems cannot detect.
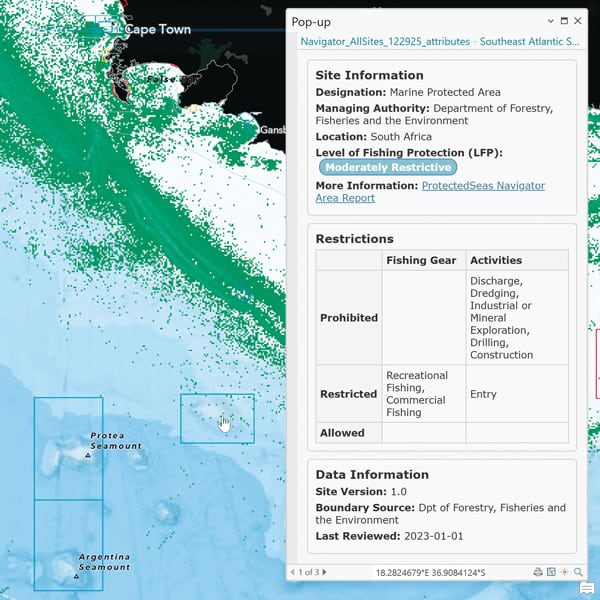
Marine conservation practitioners can use Vessel Presence and Fishing Effort data to identify critical habitats, monitor activity near marine protected areas, and assess the cumulative impacts of fishing on biodiversity. Data gathered in this way can support negotiations for new marine reserves and inform management of existing ones, providing the evidence base policymakers need to make decisions with confidence.
For planners and regulators involved in offshore energy development, the SAR Fixed Infrastructure layer provides a current, authoritative inventory of platforms and installations across major ocean basins. Combined with other ArcGIS Living Atlas layers—such as bathymetry datasets, ocean current models, or habitat classifications—the new data helps ensure that infrastructure planning accounts for the full marine environment rather than just what is visible from shore.
Getting Started with the Layers
The new layers, which users can access in ArcGIS Online and ArcGIS Pro, build on previous ArcGIS Living Atlas fishing layers, with expanded topic coverage, greater spatial and temporal detail, and multiyear time-series coverage.
For fishing vessels that have long operated beyond the reach of public monitoring systems, the SAR layers in particular represent a meaningful shift—satellite radar is indifferent to switched-off transponders, fog, and darkness. The world’s oceans remain vast, but the window into what happens across their surface has never been clearer.
For more information on these layers, email Keith VanGraafeiland at kvangraafeiland@esri.com.