
What if planners from neighboring communities or different parts of the world could share their planning information with one another? Using the same technology, the same language, the same maps, they could see how other cities are zoning new developments, building much-needed housing, and preserving green spaces. They could even evaluate how their plans either contribute to or detract from local, regional, national, and international goals to cut greenhouse gas emissions, protect natural resources, adapt to changing weather patterns, and promote economic growth.
Two interconnected projects seek to foster these connections among planners and the communities they serve. The Global to Local to Global (GLG) Climate Mitigation Implementation Project, led by geodesign expert Dr. Carl Steinitz and an international cadre of geospatial thinkers, is bringing together individual climate mitigation projects at the local, regional, and global levels in one platform to evaluate how they would work together to cut global emissions by 2050. OpenPlanMap, a forthcoming component of Esri’s Community Maps Program, will encourage planners to share their planning data in ArcGIS Online so that they and others can compare their work with adjacent jurisdictions, explore plans from around the world, get a general understanding of their plan’s CO2 impact, and see whether local climate mitigation initiatives align with global goals.
 Swipe Comparison,\" displaying North America. The western US is shaded yellow and orange, while the eastern US is purple, indicating different climate zones. A legend on the right explains the color classifications.")
“The idea is to let people view their communities’ plans in context and see what’s happening at other scales,” said Esri president Jack Dangermond. “In Southern California, for example, hundreds of communities could share their plans and develop a patchwork quilt that provides a picture of what’s happening across the region. If planners around the world share their information, then regional, state, national, and even global agencies can understand what’s being planned at an aggregate level.”
Both projects are ambitious. At a time when disconnect and disquietude seem to capture the prevailing mood, these undertakings deal in the art of the possible—in what communities may be able to achieve when it comes to sustainable, climate-friendly development.
The Urgency of Mitigation
The last 11 years have been the warmest on record, and ocean temperatures and concentrations of greenhouse gases continue to increase, according to the World Meteorological Organization. Rising sea levels, coastal erosion, thawing permafrost, and extreme weather are forcing residents to move from places as disparate as the Pacific Islands and the Arctic. Many millions of people may need to relocate in the next century due to lack of local water and food, according to “Future of the Human Climate Niche,” a paper written by Dr. Chi Xu of Nanjing University, and others, and published in PNAS.
“Millions of people are in crisis now, and they need to adapt immediately,” said Steinitz, honorary professor at University College London and the Alexander and Victoria Wiley professor of landscape architecture and planning, emeritus, at Harvard University. But what we urgently need to focus on, he says, is mitigation.
“Adaptation is short term because much will be overcome in two, maybe three generations if temperatures continue to rise,” he explained.

There are mitigation plans being made—at the local, state, regional, and global levels. But how do they all connect? How can city government officials be sure their new housing, transportation, and zoning plans will protect water supplies and reduce the amount of carbon dioxide emitted into the atmosphere? And how can leaders of global organizations, such as the United Nations and the World Trade Organization, establish goals that aren’t merely aspirational but are actually feasible?
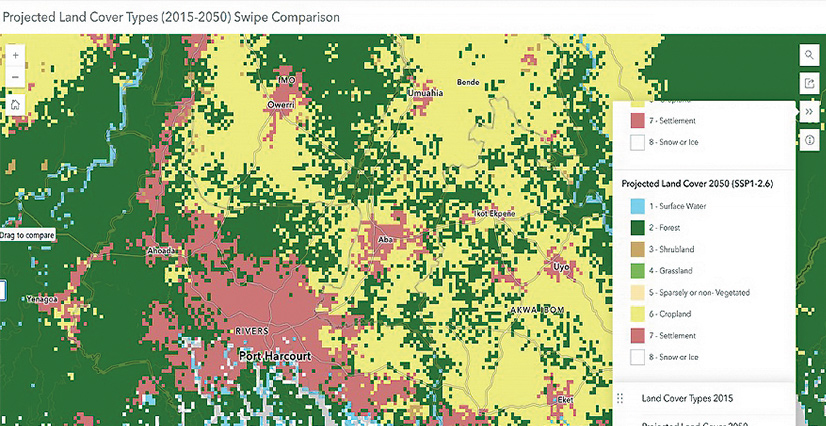
Steinitz and a team of experts from international universities and Esri are taking concepts from geodesign to link localized plans with global goals. The team has created projective maps that compare existing climate conditions everywhere in the world, at one-kilometer grain, to what climate conditions and land use are credibly predicted to be in 2050 if current trends persist and if, on the other hand, targeted climate mitigation projects are implemented. Using AI, the team has developed a range of numbers assessing various emissions reduction scenarios, as well as what each of those scenarios would cost.
“Our experiments say that we can produce 80 gigatons of CO2 reduction for around 3–5 percent of annual global GDP”—much less than what a one-degree-Celsius increase in temperature will cost the world, Steinitz said. “That’s a very good investment with enormous secondary benefits.”
The hope is that with this system, and by using modern geospatial technology, local government planners and GIS practitioners will be able to create planning documents that conform to what’s needed nationally and internationally to mitigate Earth’s rapidly changing environmental conditions.
“The technology is finally here to be able to think about solutions to this global problem—not merely by looking at each national piece separately, but by thinking and designing across global to local to global scales,” Steinitz said.
Connecting Local, Regional, and Global Projects
Most nations have between 3 and 12 climate regions—and those regions will change over the coming decades, according to Steinitz. China, for example, has 12 climate regions, which range from subtropical moist to polar moist and cool temperate dry. Each nation and its climate regions demand different ways of implementing broad policies, not least because of their economic, social, and environmental diversity, as well as how ready they are to tackle climate issues. But these more viable local plans also need to connect at larger extents.

Steinitz and his team have developed 117 climate mitigation project types spanning nine land-use and land-cover categories, such as energy, forest, agriculture, and ocean, that can be implemented across 10,000 jurisdictions in nearly 200 nations. Detailed Gantt charts, plus maps and simulations built in ArcGIS Pro, show the emissions reduction and cost impacts of these projects if carbon emissions increased at different rates through 2050.
The focus on climate regions is important. Plans developed at the national level shouldn’t be monolithic. In the United States, for example, Phoenix, Arizona, and Madison, Wisconsin, shouldn’t have the same climate plan, Steinitz pointed out.
The workflow that he and his team have developed is designed to test, not prescribe, pathways to climate mitigation. But the hope is that it can bring local planning initiatives out of their silos and into the global milieu, give context to climate mitigation projects of various scales, and inspire collaboration.
Increasing Access to—and Uses for—Planning Data
Currently, however, there’s a data vacuum in the planning sphere—not just at the global scale but at local levels, too.
“No two jurisdictions use the same categorizations for land use and zoning. There is no common language where one city’s map legend matches another’s. They’re similar in that they both have commercial and residential types of land use, but there’s not a direct match,” said Dr. Ryan Perkl, Esri’s lead for geodesign and planning. “There’s also no centrally located spot where people can find anyone’s plan.”
The initial vision for OpenPlanMap is to make those plans available, in their original formats, in one place for the first time. This will open up planning data across entire landscapes instead of having them stop at jurisdictional boundaries. OpenPlanMap will also translate plans into a common land-use classification—and into and from various languages—so that they’re comparable across cities, counties, regions, states, and nations. In addition, OpenPlanMap aims to share a plan’s potential CO2 impacts.
“This is a laborious task, given the heterogeneity of the plans that will be submitted to OpenPlanMap,” said Perkl. “We’re engineering AI-assisted ETL [extract, transform, and load] processes to facilitate that translation, which is novel.”
Once this data is accessible, people can start investigating it to see how their local plans might affect environmental factors in their cities, regions, and beyond. This will eventually allow planners and other users to work on climate initiatives across scales, like GLG is doing. The idea is to foster local, regional, national, and international cooperation on strategies to reduce carbon emissions around the world.
“The ambition of OpenPlanMap is that it starts that dialogue,” said Perkl. “When a jurisdiction is confronted with the impacts of its plan—whether it takes CO2 out of the atmosphere or contributes more, or whether it improves forests by 1 percent or 5 percent—maybe it motivates that community to improve its sustainability efforts.”
Eventually, the team would like users to feed their climate plans into OpenPlanMap and have them assessed according to the GLG’s parameters to see how much their projects will reduce carbon emissions and how much that will cost.
“The objective is to help people around the world decide what to do and how to get it done,” Steinitz said.
-
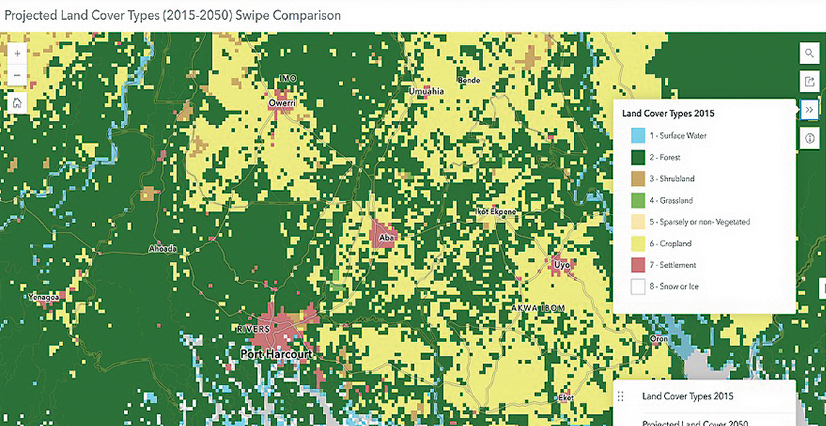
Climate regions, land use, and land cover will evolve as Earth’s environment changes.
Two Continually Evolving Projects
The OpenPlanMap being released this year is the first version of a system that will evolve over time. The more jurisdictions that submit planning information—from places all over the world—the better the data will be.
“As planning frameworks get fed together, perhaps that inspires local jurisdictions to take part in the kinds of highly impactful climate projects that GLG is promoting,” said Perkl.
The GLG project is also evolving. The team is working on automating the entire GLG workflow, and it is looking into how to apply AI to project the results of existing climate mitigation plans to 2050 so that their effects can be rigorously evaluated.
Climate mitigation is “the most important design problem in the world,” according to Steinitz, so this is the kind of bold action that’s needed.
“I hope OpenPlanMap and the GLG methodology will be adopted and adapted as broadly and rapidly as possible,” said Steinitz.