Public Works Department in Topeka, Kansas, Uses ArcGIS Insights to Organize and Present Budget Information
The Public Works Department for the City of Topeka, Kansas, designs, builds, renovates, and operates public projects. These range from bridges, traffic signs and signals, and city-owned trees to streets, sidewalks, and parking meters and garages. The department strives to deliver programs and projects that enhance public health and the quality of life for everyone who lives in and visits Topeka.
Because the department relies on public funds, it has to collect and share accurate data about its programs and projects to enable leaders to make informed decisions about how funds are spent, as well as to increase transparency with the public. Tracking this information is the responsibility of the department’s technical support group (TSG) division.

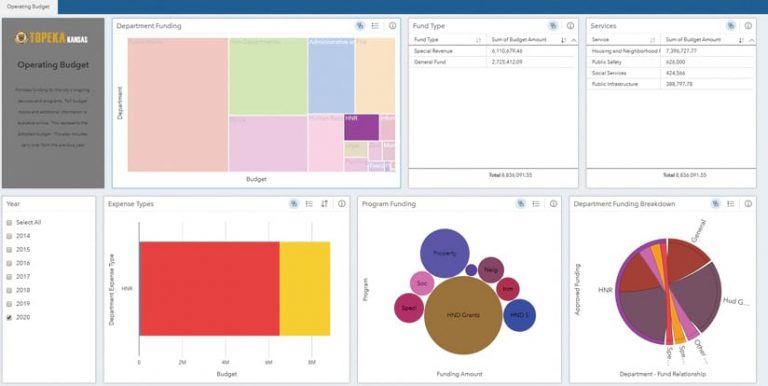
Toward the end of 2019, the TSG decided to upgrade how it displays the Public Works Department’s budget information. It wanted to do this in a clear way so the public could understand where funds are allocated and others at the city could more easily see how finances are distributed among various departments. The division chose to use ArcGIS Insights for its advanced analytics capabilities and engaging visual displays.
A Need to Share Financial Information
According to TSG division manager Brandon Bayless, various divisions and departments within the City of Topeka were not sharing financial information, which meant there were likely no larger discussions going on about the data. This made it difficult for different units to collaborate and get the details they needed to make data-informed decisions. What’s more, residents didn’t have a good idea of how public funds were being used.
“For the city, there’s been a big push to have reliable, timely, and accurate information [to help] make better decisions based on support data,” said Bayless. “A lot of the information was not necessarily being shared or analyzed.” The data was there, he said, but were various departments able to infer anything from it?
Bayless explained that ArcGIS Insights ended up being a great solution to this problem because it had all the tools the TSG needed to display data in a web-based platform. Darren Haag, a solutions architect in the TSG division, agreed.

Everything that’s done around the city, whether it be fixing potholes or fixing water main breaks, has a location. Being able to analyze that and show people on a map or [provide] information [visually] is extremely beneficial.
“When I was going through and building different pieces for open data, I knew I wanted to utilize ArcGIS Insights, and I thought the budgets were a good [way] to use it,” said Haag. “Even though we don’t necessarily need to map that data, I felt like ArcGIS Insights is a powerful business intelligence-type application that we could use for financial data.”
With ArcGIS Insights, the TSG can bring in information that, when applied to real-world situations, gives the city a more holistic picture of what’s going on.
“Everything that’s done around the city, whether it be fixing potholes or fixing water main breaks, has a location,” said Bayless. “Being able to analyze that and show people on a map or [provide] information [visually] is extremely beneficial.”
More than Numbers on a Spreadsheet
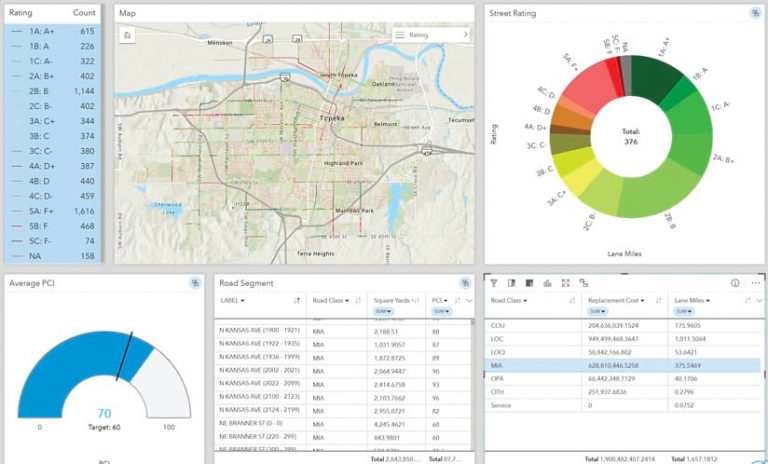
With ArcGIS Insights, the TSG division can provide city employees and the public with more than just numbers on a spreadsheet. It can present information visually, making it easier to understand.
Within the Public Works Department, ArcGIS Insights has improved data collection and analysis. According to Bayless, managers used to spend the majority of their day trying to access and extract data using the city’s financial software, which produced spreadsheets and standard text reports. It took them from an hour to an hour and a half to pull the data, create a ZIP file, and post it to an FTP site. Now, however, managers can easily collect any data requested by the public, city council members, or others and make it available to download via a link on the city’s open data website.
“ArcGIS Insights reduces the time needed to pull data. Now it’s a very simple email response,” said Bayless. “That’s one of those efficiencies that makes things work smoother because we’re not having to put pressure on somebody to do all this manual work.”

While the Public Works Department is still in the process of setting up ArcGIS Insights on its internal enterprise GIS platform, it is already realizing how beneficial the analytics app is.
“In the short time we have been using ArcGIS Insights, it has become apparent how much more efficiently our time will be used in exploring and analyzing our data,” said Bayless.
The Public Works Department is employing ArcGIS Insights to house the budgets and financial data for three of its divisions. This has saved time and improved accuracy. The ease of data input and analysis has enabled division managers to better track their actual spending, analyze trends, and find areas where additional funding is needed or where budgets can be reduced.
“The data and analytics that we provide with ArcGIS Insights or that we empower other departments to use help them make better decisions, which benefits the community,” said Bayless.
For residents, having access to the eye-catching charts, graphs, and tables in ArcGIS Insights empowers them to find answers to their questions. This frees up city staff so they can focus on the services they provide.
Haag said ArcGIS Insights is easier to use and better organized than other tools the department tried. While he believes that it could elicit more questions from residents once they review the data, Haag welcomes those questions because they help staff know what’s important to people.
“They possibly see trends or look at things and ask questions like, Why is this showing this? or Why aren’t you doing something here?” said Haag. “It opens up that line of communication, which can help make the organization work better.”
“We’re able to more effectively and more efficiently provide services to residents,” added Bayless.

