In 1791, president George Washington commissioned French engineer Pierre Charles L’Enfant to plan and design the District of Columbia, the permanent capital of the recently founded United States of America. L’Enfant envisioned important buildings and monuments occupying strategic locations based on changes in elevation and the contours of local waterways. He took inspiration from European cities, with the National Mall patterned in part after the Champs-Élysées in Paris, France, and streets radiating out from the city center to resemble Karlsruhe, Germany.
Today, the capital’s roadway network is maintained primarily by the District Department of Transportation (DDOT) and includes 1,100 miles of public roads, both local and federal; 1,495 miles of sidewalks; and 358 miles of alleyways.

Because of heavy traffic throughout the year and adverse weather conditions during winter months, the window to repair and maintain the capital’s roadway network is small. It starts each spring and continues into the fall, requiring a concerted effort to accomplish all the necessary work.
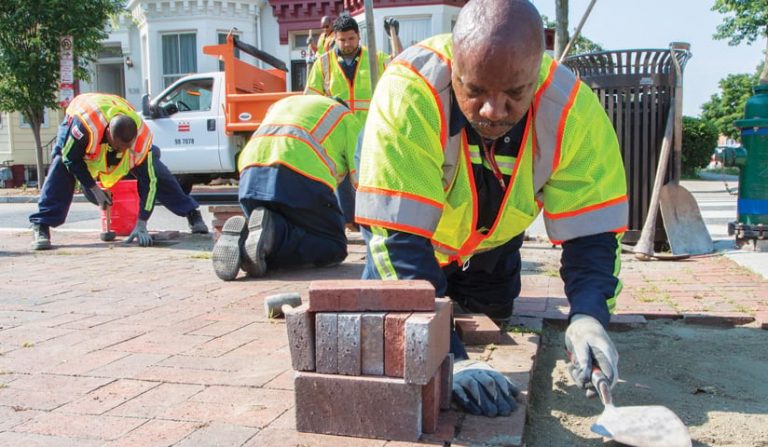
In 2018, mayor Muriel Bowser announced the launch of the PaveDC Paving Plan, a comprehensive initiative to fix all roads rated in poor condition in Washington, DC, by 2024. PaveDC has four priorities: road rehabilitation, road maintenance, alley repair and reconstruction, and sidewalk reconstruction.
“For the PaveDC initiative, we first created the PaveDC Asset Repair Prioritization Model,” said Dr. Ting Ma, performance manager at DDOT. “We began by assembling three different datasets. The primary dataset comes from our annual pavement condition index. This is created by surveying every road in the district. Then, the roads are assigned a value from 0 to 100 based on their condition—how many potholes, how many cracks, and so on. Those roads with the lowest scores need the greatest attention.”
DDOT derives another dataset from its 311 service call request line, which residents use to report nonemergency roadway problems. The calls are tabulated according to location and the type of repair requested and then compiled into a dataset. In addition, DDOT has an Americans with Disabilities Act (ADA) compliance dataset to ensure that people of all abilities can travel safely around the city.

“These three datasets are compiled and then an algorithm is applied to the data that creates a new index, called the Roadway Repair Index,” said Ma. “It is used to rank the need for repair of each roadway in the district and prioritize the repair and construction work. Using these three separate datasets provides us with a more comprehensive and holistic evaluation of roadway conditions.”
PaveDC enables the DDOT to pave more roads more quickly. In 2018, for example, the department paved 55 miles of roadway, whereas in 2019, it paved more than 100 miles of roadway—the most DDOT has ever done in a single year.
DDOT is using the Esri Roads and Highways extension to build its digital roadway network and maintain the data. For the PaveDC analyses, Ma uses a segmentation tool and geoprocessing tools in ArcGIS Pro to aggregate the data from three sources down to the block level. From there, she can visualize the data and apply weights to test different cost estimates for road repairs. This data visualization is used to balance road repairs in all eight wards to ensure that DDOT maintains roads equally throughout the district.
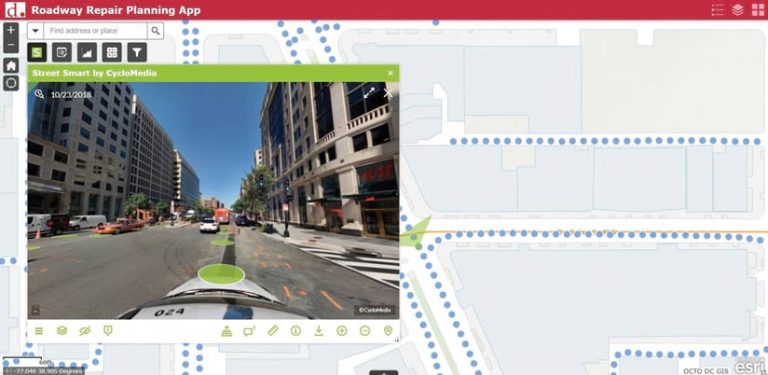
In addition, DDOT used ArcGIS Web AppBuilder to create an app that supports collaborative editing and data verification and has street view images from Esri partner Cyclomedia.
“Our engineers and inspectors use this app to determine whether or not there is a conflict on the roads we intend to repair with underground utility work being performed in the same area,” said Ma.

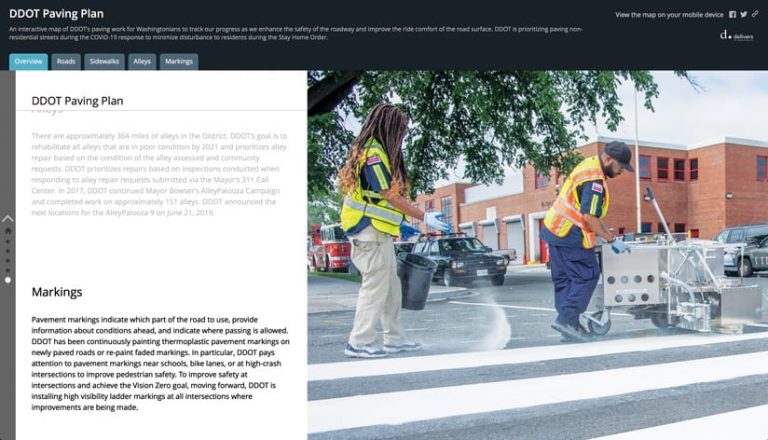
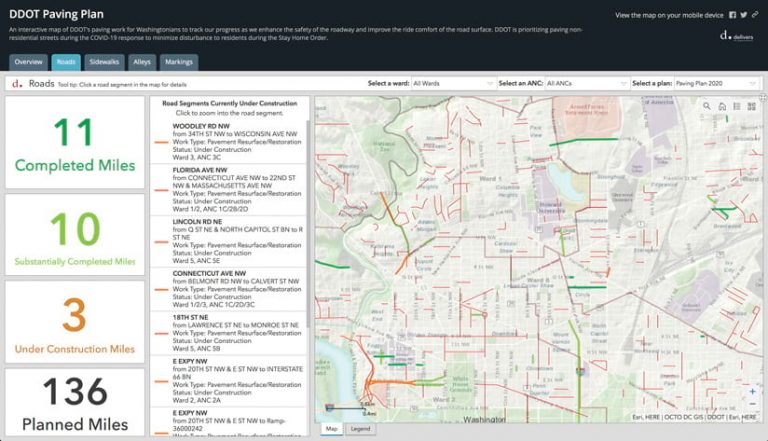
To keep the public informed about its work, DDOT created and launched the DDOT Paving Plan website in 2018. It’s the agency’s first interactive and real-time paving plan communication tool for the public to explore asset repair and work plans and track the status of projects. By presenting an overview of the various services PaveDC provides, the website informs users about what to expect before and during construction. Users can find specific information on roadway paving, sidewalk and alley repair, and pavement-marking improvements on four separate dashboards. The dashboards are interactive, allowing users to click on assets to find information about them or review specific wards or the advisory neighborhood commissions (ANCs) they are interested in. The website uses several ArcGIS products, including ArcGIS StoryMaps, ArcGIS Dashboards, and ArcGIS Online maps, to convey details about the projects DDOT is working on. It shows the status of the repair work, how many miles of roadway are currently being repaired, and how many miles have been completed. To communicate more effectively and directly with residents, DDOT posts PaveDC updates to its Twitter account as well, using the hashtag #PaveDC to connect the posts.
“The website allows us to provide greater transparency and engagement with the general public,” said Ma. “Our residents love our PaveDC website. Since its launch, it has received more than 30,000 visits.”
The website also keeps various divisions within the transportation department up-to-date on progress, which provides an incentive to continue doing innovative work, according to Ma.

“We use it to present a status report on the work we have accomplished during the past week,” she said. “This takes place at our weekly meetings with the executive team. So internally, PaveDC is also a performance management tool.”
PaveDC provides a good example of how technology and accurate data can transform the way transportation agencies manage their infrastructure assets.
“At DDOT, we keep exploring and learning new technologies to improve our PaveDC work,” said Ma.
DDOT is currently automating its geoprocessing and data prioritization process using ArcPy and other open-source data science libraries. It is also beginning to investigate the use of artificial intelligence (AI) to determine roadway repair needs more quickly.
“In 2017, it took us nine months to complete our survey of the district’s roadway network. This was before the inception of the PaveDC project, which reduced this time,” said Ma. “But AI technologies, such as machine learning, can further reduce the survey time and speed up roadway repairs. We are all excited about learning emerging technologies, and we are committed to leveraging them to provide better and safer roads to Washingtonians.”

