With Lidar and ArcGIS Spatial Analyst, Company Accurately Documents Archaeological Elements at Colorado Gold Mining Town
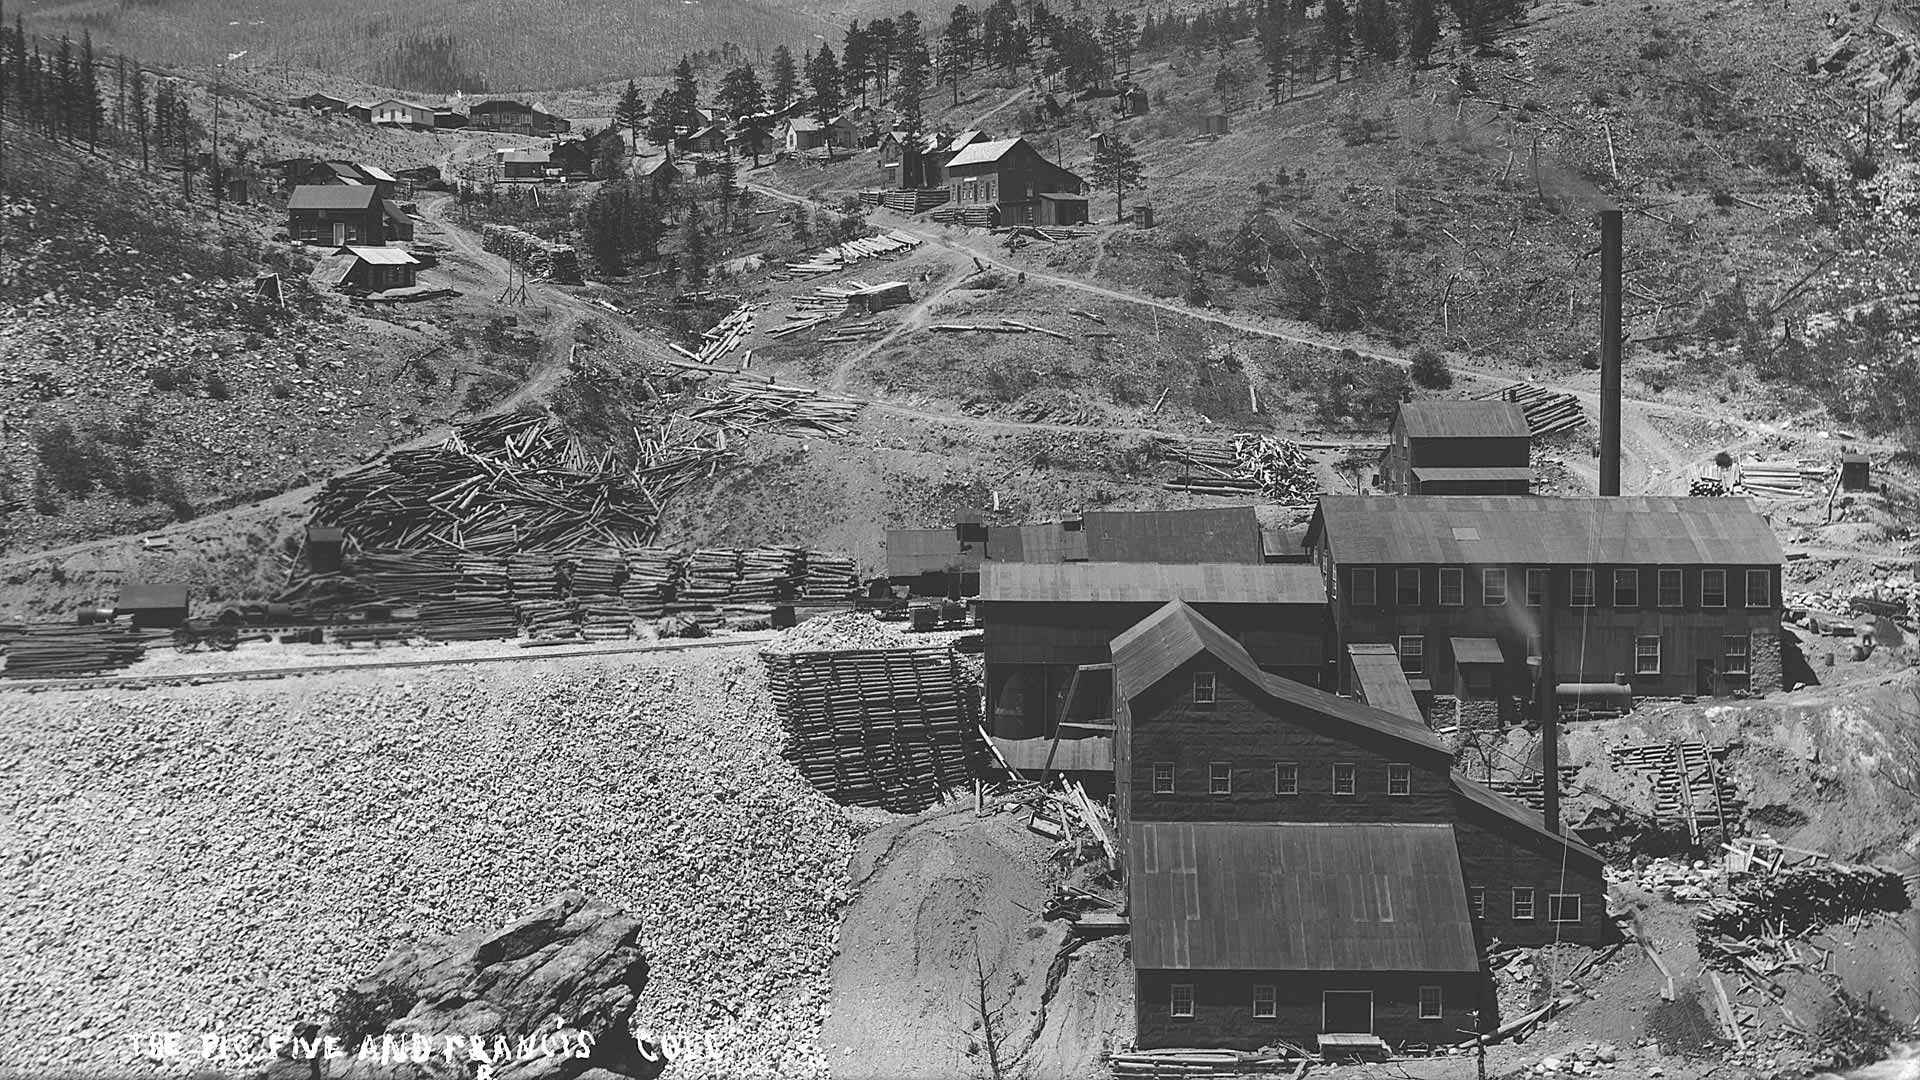
For about two decades from the late 1890s to the late 1910s, the Frances Townsite, in western Boulder County, Colorado, was a mining town. Located by a natural spring in a moderately high-elevation mountain gulch, the community served miners from a number of local gold mines within the immediate vicinity.
Built around a mill, the town was formally established in 1897 when a railroad constructed a station there. While large-scale mining diminished by the early 1900s, Frances continued to serve independent miners and a burgeoning tourism industry until 1919, when the railroad closed and the town was abandoned.
The neglected buildings in Frances slowly began deteriorating. People removed some of the building materials, and the town became an archaeological site. It now sits on a combination of federal, county, and privately held lands.

In 1997, archaeologists documented 52 former structures, or elements, in Frances, including leveled platforms, privy (outhouse) depressions, stone building foundations, and root cellars. Based on historical photographs, the archaeologists suspected that there were other elements in the area but that they had been obscured by natural processes.
Not too far away, the Colorado Department of Public Health and Environment (CDPHE) and the Environmental Protection Agency (EPA) have been cleaning up the Captain Jack Mill Superfund site, where the soil and surface waters remain contaminated with metals and other hazardous materials, largely from mining. As part of the cleanup’s mandate, the Bureau of Land Management’s Royal Gorge Field Office (BLM-RGFO) requested that nearby historical resources, such as the Frances Townsite, be shielded from any associated impacts.
To that end, in the fall of 2016, CDPHE hired Alpine Archaeological Consultants, Inc., to conduct an intensive site recordation of Frances and to update the site map. The objectives were to better understand the town’s spatial organization and to provide the BLM-RGFO with an accurate map so it could more carefully manage this significant archaeological resource.
The BLM-RGFO requested that the site be documented using high-precision technology and modern GIS. By collecting lidar data from The National Map, hosted by the United States Geological Survey (USGS), and employing the ArcGIS 3D Analyst extension for ArcGIS Desktop, Alpine was able to create a precise composite digital elevation model (DEM) of the townsite’s modern surface. In addition, the company used highly accurate on-the-ground robotic survey technology to detail all the elements at the site.

Identifying Elements with Lidar
The team at Alpine assumed there were going to be difficulties in rediscovering and rerecording the Frances Townsite. When the BLM-RGFO did the original site recordation in 1997, it didn’t use a GPS receiver, and a local archaeologist hand mapped the townsite. While the map did detail all 52 elements’ locations and was a fantastic resource for Alpine, the team wasn’t sure how accurate it was, since hand-drawn maps are prone to scaling mistakes. Furthermore, the team at Alpine thought that other elements in the townsite might have been obscured by environmental processes, such as erosion or infilling.
Focusing its analysis on the map’s original site boundary, the team planned to use the lidar dataset from The National Map to identify additional elements in the townsite, such as platforms, depressions, roads, and railroad grades. The first step was to process the collection of LAS files using a geoprocessing tool in ArcGIS Desktop called Create a LAS Dataset. This allowed the team to work with the collection of LAS files as if they were one and to do so directly on the LAS files without converting them.
Alpine only wanted the ground data, so once the multipoint dataset was ready, the team filtered out disturbances—such as canopy and water structures—using the Filter tab on the Layer Properties dialog box of the LAS dataset. When it had a clean dataset, the team used the LAS Dataset To Raster tool to create the DEM.

The most common DEMs available in the United States and North America are taken at 10-meter resolution. But The National Map dataset that Alpine was using had point spacing of 0.411 meters, which is excellent considering that the availability of 1-meter resolution DEMs in the United States is sparse. This high-resolution lidar data was able to differentiate among ground surfaces; low, medium, and high vegetation; buildings; water; rail and road surfaces; and more, making it relatively simple for the team to filter out any surfaces it didn’t need.
Once the raster was ready, the team used the Hillshade tool in the ArcGIS Spatial Analyst toolbox to create a hillshade so it could begin identifying potential elements in the Frances Townsite. The Hillshade tool produced a grayscale 3D representation of the area, putting shadows in stark relief. This enabled the Alpine team to zero in on areas that looked like depressions both in and immediately around the original site boundary. These depressions were potential evidence of buildings and other elements associated with the townsite.
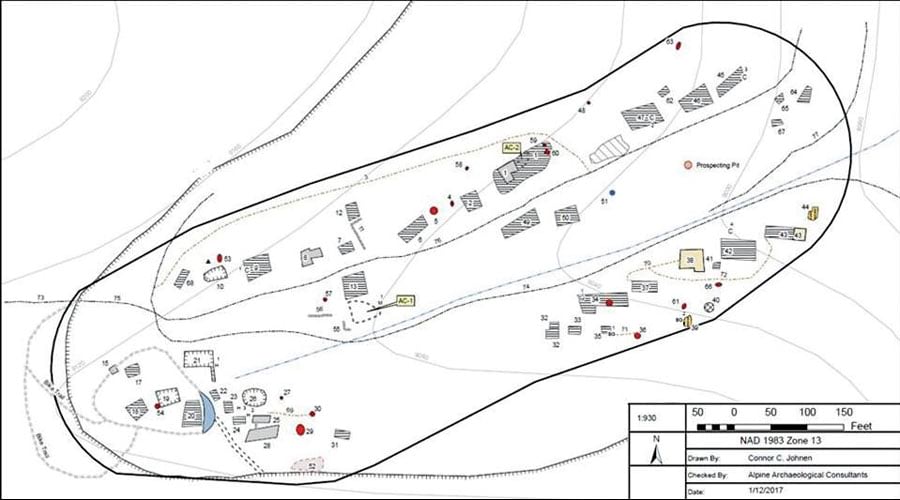
With the hillshade map, the team identified 37 depressions and/or platforms, as well as 5 linear elements that were interpreted as roads. The findings were a mix of previously recorded elements and newly identified ones—including 16 new platforms—and they were found both within and outside the original site boundary.
Verifying Analysis in the Field
The next step was to go out into the field to look for these elements. The team created a new map of the townsite with all the elements on it and then uploaded the elements’ points into a Trimble GeoXT handheld GPS receiver. Knowing exactly where the elements were made it much easier to find them in the real world.
Once on-site, the team used the results of its analyses to verify where the elements were located. They then used Trimble’s S7 Total Station—a piece of surveying, imaging, and 3D scanning equipment capable of subcentimeter accuracy—along with a GPS unit capable of submeter accuracy (for redundancy), to record the details of each element.
Thirty-two of the depressions and platforms found in the hillshade turned out to be historic elements of the townsite itself. While the remaining five depressions were not specifically associated with Frances, they did reveal other ways in which the landscape was historically used. Some ended up being prospecting pits dug up during the mining boom, while others had to do with modifying the landscape.
Back at the office, the team processed the resultant data using ArcGIS Desktop 10.4 and created a new, highly accurate map of the Frances Townsite. The BLM-RGFO now uses it to better manage this significant Colorado gold mining site, which will ultimately help protect it.
For more information, contact Connor C. Johnen at connor_johnen@alpinearchaeology.com or 970-249-6761, or email Michael J. Prouty at mike_prouty@alpinearchaeology.com.