Revolutionizing Utility Management in Texas with ArcGIS Utility Network
Denton Municipal Electric (DME), a community-owned utility based in the northern Texas city of Denton, needed to upgrade its electric system management. The existing software, pivotal to DME’s operations, was approaching the end of its support life cycle, adding risk to operational stability. The challenge was not only in complexity but also in the critical nature of the systems involved. Recognizing the need for a more advanced and efficient system, DME turned to Esri partner POWER Engineers for its expertise in utility network migrations and client-centric solutions.
DME and POWER Engineers began a transformative journey, leveraging ArcGIS Pro and ArcGIS Enterprise. They also shifted from an ArcMap geometric network to ArcGIS Utility Network, integrating the ArcGIS Utility Network Management extension and ArcFM Solution.

It was not just a technological shift but a pivot toward improved operational efficiency. DME’s distribution data and system infrastructure were transformed, showing substation and transmission systems in Utility Network capability-based GIS for a comprehensive network model.
The result was a more intricate, interconnected, and intelligent utility network, enabling DME to model and manage its network with greater precision and leading to improved reliability and customer service. The Utility Network migration enabled DME to use advanced network analytics and provide detailed asset information to its advanced distribution management system, enhancing situational awareness and operational efficiency. It also reduced errors and the number of revisions while cutting costs and improving service, including shortening service-restoration times. These data quality and system standardization enhancements have streamlined operations, cut down on design and engineering time, and elevated productivity.
This network upgrade’s success highlights solutions that accomplish utilities’ goals of improving service delivery and customer engagement. The Utility Network migration has equipped DME for refined network analytics and detailed asset management and laid the groundwork for making informed, data-driven decisions, exemplifying the transformative impact of GIS technology in modern utility management.
Keeping Pace with Community Growth Using Esri and Trimble Cityworks
Rexburg is a bustling college town in eastern Idaho that has undergone considerable growth and expansion in recent years. The city uses ArcGIS Pro, ArcGIS Server, and ArcGIS Field Maps (for asset management activities), as well as Cityworks’ Permitting, Licensing, and Land (PLL) solution from Esri partner Trimble to keep up with the rising number of customer requests associated with the growth of the community.

In Trimble Cityworks, built on ArcGIS Pro and ArcGIS Server, GIS serves as a foundation that supports every step of the permitting, application, and inspection process for any construction or renovation project. ArcGIS is a critical component of Rexburg’s community management operations. Together, Esri technology and the Trimble solution give Rexburg the ability to easily track and complete permitting, application, inspection, and asset management activities using location-based data.
“One of the neat things we can do with GIS is use the Search Cases feature when viewing Trimble Cityworks maps,” said Faron Young, asset management system administrator for Rexburg’s public works department. “This allows us to pull up the historical data of everything that has been done in a specified area.”
With more than nine years of Cityworks PLL and GIS data under its belt, Rexburg is able to pull from an expansive repository of historical information to reference and gain a full scope on community projects, making permitting, reporting, and infrastructure management more efficient.

Rexburg is leveraging the Cityworks PLL solution to track and complete 38 types of permits, applications, and inspections—rezoning, city annexations, new construction, street excavation, hydrant use, and more. In tandem with ArcGIS Pro and ArcGIS Server, PLL greatly simplifies workflows and allows the city to organize and track work activities in one digital location.
“Going forward, everything will be searchable and digital,” observed Bret Stoddard, building official for the City of Rexburg. “When people submit applications or plan reviews, it will never be on paper.” The earlier permitting agencies go digital, he said, “the easier it is to populate historical data and keep track of future data.”
Modernizing Water Utility Data Collection Workflows with ArcGIS Online
Hampton Shale Water Authority (HSWA) is a small water authority in western Pennsylvania that services eight municipalities and distributes more than five million gallons of water per day to about 29,000 customers.
In early 2022, HSWA decided to better leverage its investment in GIS and streamline its workflow processes to reduce the time spent on outdated, paper-based forms and maps. HSWA identified several needs—improving GIS inventory, including hydrants, valves, and mains; tracking, analyzing, and reporting on water-related work assignments; and streamlining the organization’s reporting and data analysis processes. However, there were limited funds and staff resources to identify, implement, and maintain the processes and associated tools to meet HSWA’s goals.
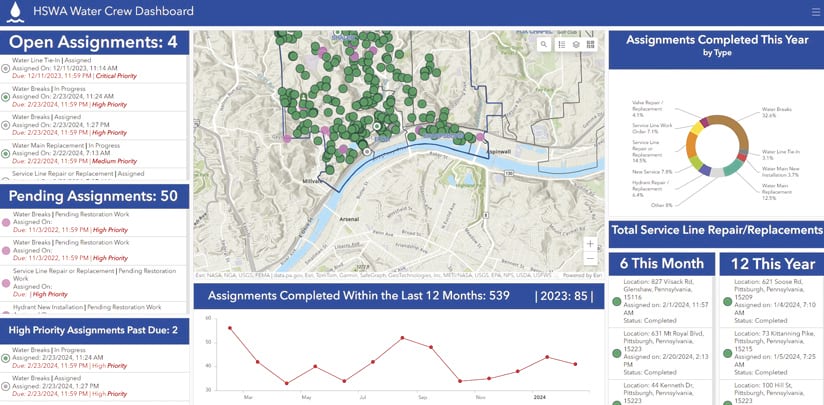
-
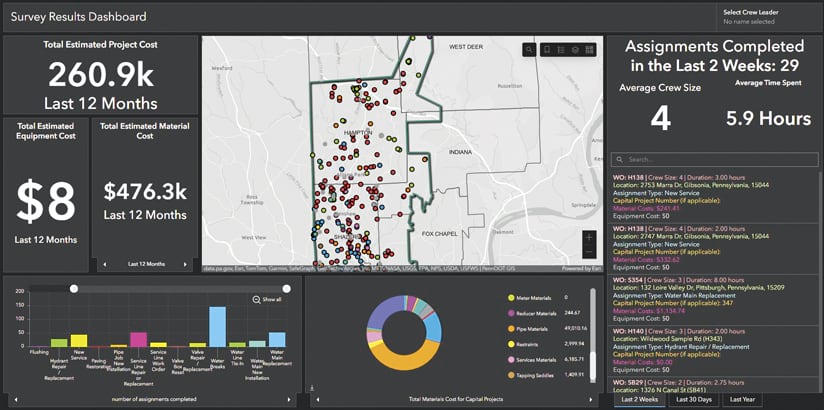
A dashboard shows ArcGIS Survey123 results for Workforce assignments and tracking material costs.
HSWA turned to Esri partner EBA Engineering, a provider of engineering and management services. EBA studied how HSWA was already using GIS and then implemented several web applications in HSWA’s ArcGIS Online environment. This enabled HSWA to collect field data while modifying and updating its existing apps.
EBA identified data-collection processes that could be automated, such as populating fields from an inspection or sending email notifications, using ArcGIS Arcade or Python scripts. This functionality was built into HSWA’s ArcGIS Field Maps set of data collection maps. Automatically populating fields has saved time for mobile crews and saved time and money by reducing the likelihood of user input errors.
Configuring ArcGIS Workforce to capture work orders, EBA modernized the task assignment process. With ArcGIS Survey123 linked to Workforce, mobile crews can accurately account for the materials and equipment used on each job, and the survey automatically calculates the associated costs. EBA also created dashboards for visualizing collected data for hydrant and valve inspections, flushing activities, Workforce activities, and Survey123 results.
These solutions give management and other office staff easy access to the total project costs associated with each job. Combined with the ability to track work history at a location or asset over time, staff can now make better decisions about repairing or replacing assets. HSWA has better technology to collect information on assets, better apps and processes to collect the data, and clear and concise information dashboards, giving stakeholders a much clearer picture of the assets they manage, and the time and money associated with managing them.
Getting Lead Out of Drinking Water with Predictive Modeling and GIS
Lead pipes present a critical public health issue, according to the US Environmental Protection Agency (EPA), with lead in drinking water linked to kidney issues, reproductive problems, and more. This is why the Cary Utilities Department, serving Cary and Morrisville, North Carolina, is actively mapping its service lines. Despite these being “low-lead” communities, the department is determined to track down and eliminate all lead service lines in the system for public safety and compliance with the EPA’s Lead and Copper Rule deadline in October 2024.
The department’s challenge was tracking down a small number of lead service lines in a vast system. In 2023, Cary turned to Esri partner BlueConduit for its expertise. Based in Ann Arbor, Michigan, BlueConduit has developed a cutting-edge, predictive machine learning approach to locate lead service lines. BlueConduit serves more than 275 communities in the United States and Canada, and has analyzed more than 4.2 million service lines to date.

BlueConduit’s predictive analytics is delivered via Esri’s Lead Service Line Inventory solution on ArcGIS Enterprise. This solution helps inventory lead service lines, validate service line materials in the field, monitor replacement activities and regulatory compliance, and share information with the public. BlueConduit then adds predictive modeling capabilities and dashboards, combining local GIS data with machine learning analytics. This integration streamlines inventory creation and management, guides visual inspections, adds predictive data, accelerates lead line replacement, and improves staff efficiency.
The Cary Utilities Department is currently conducting visual inspections to determine service line materials. The information will feed into BlueConduit’s platform, providing predictions via ArcGIS Online. Updates are made as new data enriches the predictive model.
Dylan Winger, Cary’s utilities engineering GIS coordinator, said, “We’re dedicated to using the best tools available to achieve our goals.” Speaking of BlueConduit’s predictions platform, Winger said, “I’m really excited to see it in production and can’t wait to see how it dynamically updates.”