In striving for smarter, more equitable development, communities all over the world are turning to GIS, and Esri partners are helping them streamline their ideas and implement solutions. Find out how four Esri partners have worked with cities in the United States, construction companies in Europe, and a water supply agency in Rwanda to build new housing, improve road paving, and fix water supply issues—all with an eye toward enhancing sustainability.
Building Fair and Equitable Housing in California
Since 1969, all California communities have been required to plan to meet everyone’s housing needs, regardless of income. The state’s housing-element law notes that to do this, local governments have to adopt plans and regulatory systems that foster opportunities for housing development rather than impede them.

When the City of Riverside recently updated its housing-element policies, it was required to find sites that could accommodate approximately 24,000 new residential housing units by 2029. This mandate, part of a Regional Housing Needs Assessment (RHNA), is what helps every municipality in California strive to meet statewide housing needs. At the same time, the city must ensure that the housing units are Affirmatively Furthering Fair Housing, a rule from the US Department of Housing and Urban Development (HUD) that encourages communities to create real and fair housing choices. The developments must also heed environmental justice issues.
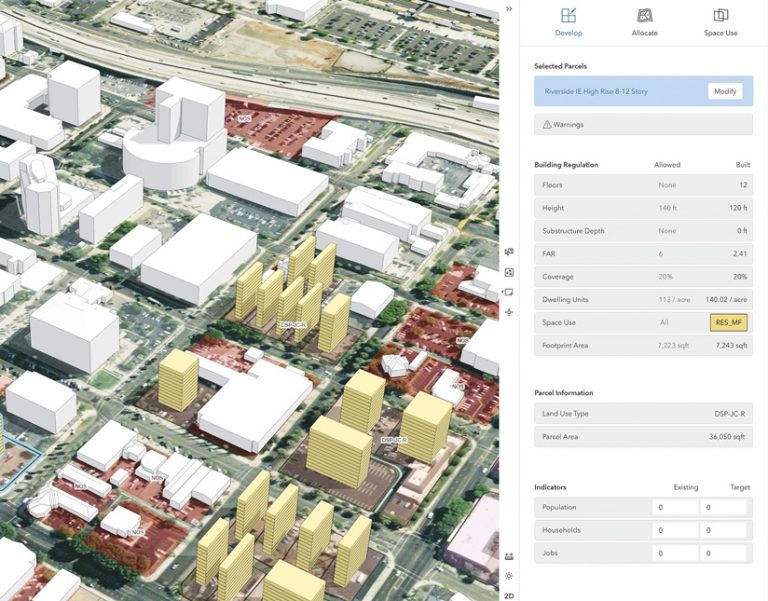
To help Riverside meet its RHNA allocation, Houseal Lavigne developed a GIS-based solution and workflow using ArcGIS Urban called the RHNA Opportunity Finder. Planners employed Urban at the outset of the project to work with staff at the City of Riverside to identify the most favorable locations for future residential development. Based on stakeholders’ feedback, the planners used RHNA Opportunity Finder to zero in on specific parcels that are well suited to accommodate a variety of housing types within these preferred locations. To further fair housing and support positive economic, educational, and health outcomes for economically disadvantaged families, the RHNA Opportunity Finder evaluated several benefits and constraints that affect each parcel, including access to amenities and proximity to sources of pollution, protected natural areas, and natural hazards.
With the resultant group of sites that take into consideration affordable housing, environmental justice, and access to community resources, planners at Houseal Lavigne employed Urban again to complete the planning process, testing potential policy changes and development scenarios. Now, the city is using the comprehensive plan to interactively engage with residents, letting them explore 3D web maps and an ArcGIS StoryMaps story, to get their input. Already, the 24,000 new homes that need to be built in Riverside by 2029 are becoming part of the fabric of the community.
Digital Twin of Road Construction Increases Sustainability
Designing smart construction processes requires organizations to connect a wide variety of data sources. In a nutshell, that’s what VIA IMC, a digital construction company based in Berlin, Germany, does in partnership with its parent company Eurovia, a global leader in transport infrastructure and industrial, commercial, and urban development.

To increase sustainability at road construction sites, the two companies want to eventually establish digital twins of their projects. But first, this requires generating 3D models of road construction. So VIA IMC brought in ARC-GREENLAB to help develop an online platform to use for this, called AVUS.Online.
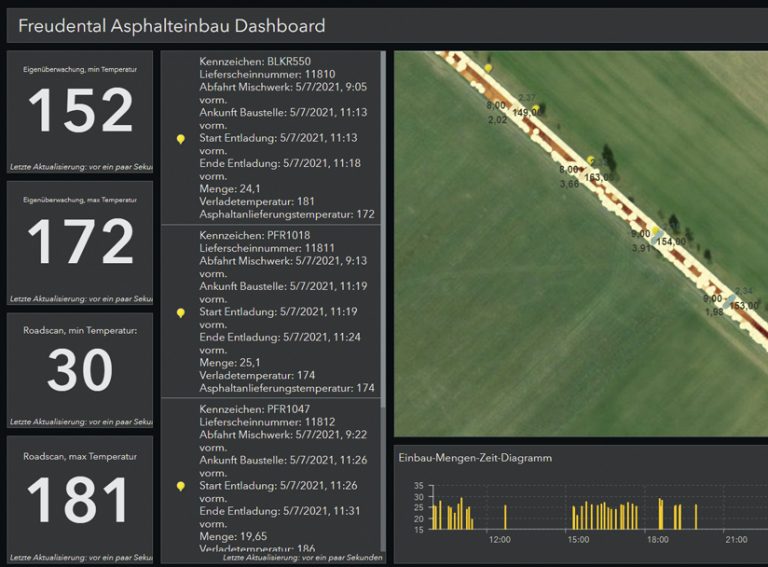
One of the main goals of the solution is to increase sustainability during asphalt-based road construction. By lowering the temperature of the asphalt by only 5 degrees Celsius (41 degrees Fahrenheit) as it is being laid, CO2 emissions can be reduced by up to 20 percent. This requires working faster and in closer coordination, so it is necessary to precisely document the locations of—and asphalt temperatures in—both heated transport trucks and paver machines.
ARC-GREENLAB helped VIA IMC by designing the system architecture and operational processes for AVUS.Online in Microsoft Azure. Project staff also ensured that the construction data that VIA IMC and Eurovia employees collect can be merged with the ArcGIS system and evaluated there.
ARC-GREENLAB staff built data models and structures; converted data using a feature manipulation engine (FME); and developed interfaces for integrating several types of data—including building information modeling (BIM) data, imagery collected using unmanned aerial vehicles (UAVs), and construction data—into a geodatabase. Using ArcGIS Enterprise, ArcGIS Dashboards, and ArcGIS Web AppBuilder, the team made it possible for VIA IMC and Eurovia staff to access and visualize the data online. Employees on construction sites can also evaluate a project’s implementation status, the quality of the asphalt, and other tasks from the field. And ARC-GREENLAB developed components like interfaces, tools, and widgets that make it possible for staff at VIA IMC to implement new apps on their own.
All this amounts to taking the first step toward setting up digital twins for construction sites. Employees at VIA IMC and Eurovia now record data in real time, combine that data with existing data, and analyze it and visualize the results on the web. This not only makes it possible for construction employees to closely monitor asphalt temperatures while it is being laid, but it also helps them optimize other logistics and processes that can further reduce CO2 emissions. Additionally, the solution is easily scalable, so VIA IMC and Eurovia can use it for construction sites across their portfolios.
A Novel Way to Visualize Infill Development
For city officials in Rocky Mount, North Carolina, the rapid pace of growth and the increasing need to develop affordable housing have strained the limits of the city’s existing land development and zoning codes.

To analyze and communicate how a potential code change or new development affects existing neighborhoods, officials didn’t just want to present stakeholders and community members with paper-based site plans. They wanted to let people see how site plans fit in with existing and other planned projects. So the city turned to ViewPro to start the iterative process of creating a digital twin.
“The deployment of an interactive tool that enables us to engage stakeholders by visually representing the development potential for properties is revolutionary,” said Rocky Mount planning administrator William Deaton.
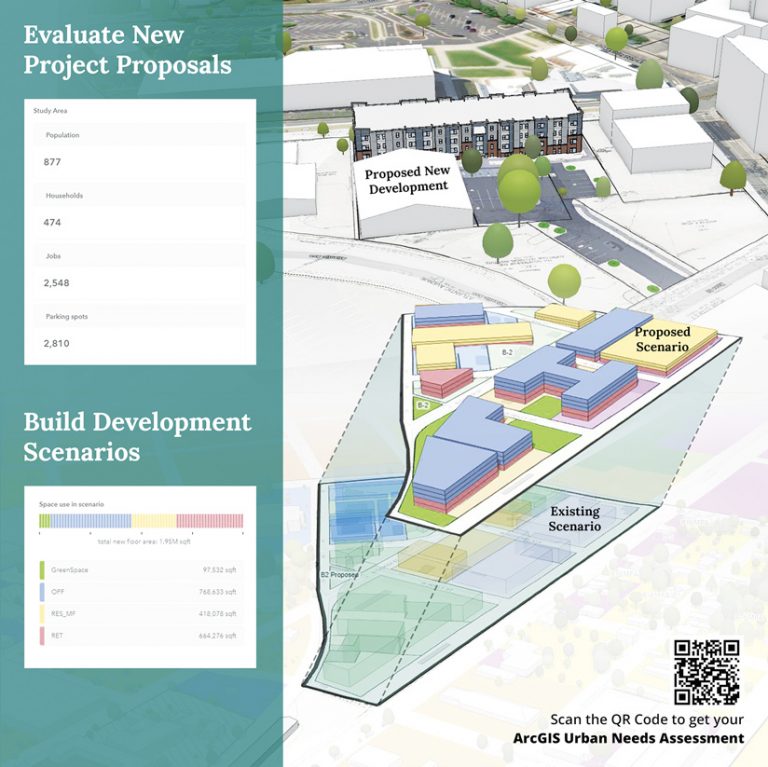
To begin the process, officials filled out ViewPro’s needs assessment to identify specific problems they wanted to solve. The next step was for ViewPro to produce an ArcGIS Urban model. This required converting traditional 2D data, such as land-use designations, floor-to-area ratios, building heights, and street orientation, into 3D data—a workable data input for building out a digital twin. Staff at ViewPro then used other Esri software, including ArcGIS Pro, ArcGIS CityEngine, and the ArcGIS 3D Analyst extension, to achieve the desired output.
To maintain cost-effective and efficient infrastructure networks amid tremendous pressure to grow, city officials want to do more infill development, which entails building on vacant or underused land that exists within a community’s current development patterns. With ArcGIS Urban, ViewPro staff are able to simulate code changes that allow city officials to demonstrate how infill developments will impact the surrounding neighborhoods. For example, stakeholders and residents can see how a multistory unit with four apartments in it will look in a predominantly single-family home neighborhood.
The interactive digital tools that ViewPro created have enabled Rocky Mount city officials to improve communication with the community, better coordinate across city departments, and save both time and money through seamless data sharing. Critically, efforts are building toward developing a full-scale digital twin of Rocky Mount, which will allow officials to use more 3D data analytics for decision-making.
“Rocky Mount leverages the ViewPro team to better position the city en route to becoming a smarter city by using cutting-edge technology like the Esri visualization toolset,” said Gregory Cotten, the city’s chief technology officer.
Rocky Mount is far from being alone in having to come up with creative ways to grow and develop more housing choices. Its use of next generation technology can be an example for other communities facing similar challenges.
Ensuring a More Stable Water Supply in Rwanda
Kigali, the capital of Rwanda, is home to more than 1.2 million people. As in other urban areas of the country, residents in Kigali frequently face water shortages. While water demand in the city is 290,038 cubic meters per day, the supply is estimated at 187,293 cubic meters per day, resulting in a gap of 102,746 cubic meters. This means that some areas of Kigali are regularly subjected to water rationing.

Rwanda’s Water and Sanitation Corporation (WASAC) wanted to ensure that a stable supply could reach more residents, so it commissioned Esri Rwanda and DHI to establish a geodatabase of its assets and develop hydraulic models of the water distribution network in the city and in 14 up-country regional WASAC branches.
To begin, staff at Esri Rwanda collected and mapped water network data throughout the country using ArcGIS mobile apps. Esri Rwanda ensured the quality of the data and loaded it into a central ArcGIS Enterprise geodatabase.
Esri Rwanda staff then built a geometric network with specific connectivity rules to represent and model the flow of water within WASAC’s network. The geometric network allows engineers at WASAC to perform network analysis to determine things like the direction of water flow, what customers are supplied from a specific reservoir, and which valve should be closed when a pipe bursts.
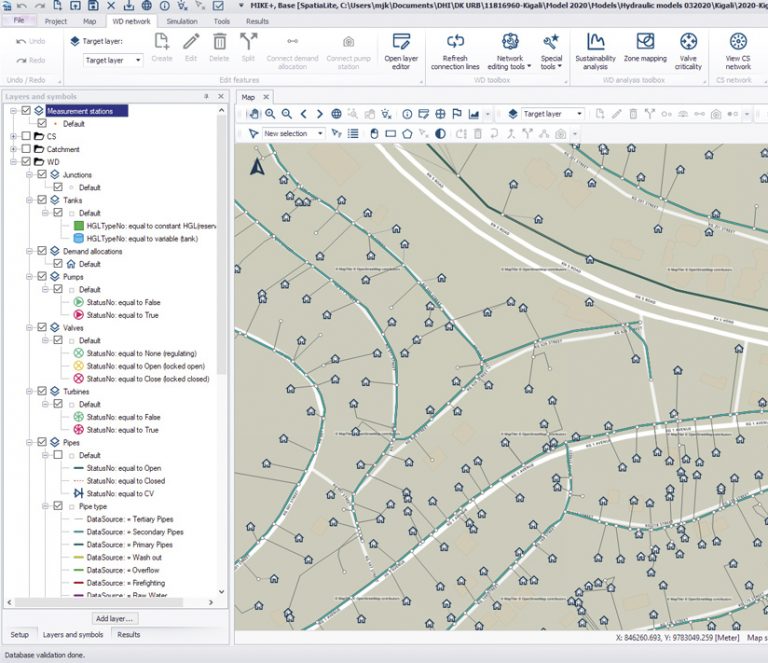
With all the data in place, DHI developed hydraulic models using its MIKE+ suite of software integrated with ArcGIS Pro. The team chose MIKE+ due to its fast SQL database, user-friendly interface, and hydraulic modeling tools designed to handle large city networks. The DHI team made 16 models in total of key water networks in Rwanda. Now, WASAC’s engineers can use these detailed representations to optimize daily operations, ensure that adequate water pressure is available to the most people, build networks to new urban areas, perform water quality analyses, and investigate many other what-if scenarios.
MIKE+ has a web interface that gives regional branch employees and section managers web-based access to the main models located on a server at WASAC headquarters in Kigali. They can use this to run hydraulic simulations and visualize the results via mobile devices while out in the field, often in remote areas. Additionally, Esri Rwanda developed a supervisory control and data acquisition (SCADA) system to allow supervisors at WASAC to automatically and remotely control some water management and distribution operations. Once fully implemented, the SCADA system will be a state-of-the-art technology in Rwanda and enable WASAC to take its water supply services to the next level. Finally, the team integrated WASAC’s billing system with ArcGIS technology and made this information available to all WASAC departments and branches so they can more easily monitor the billing process across all water distribution zones.
With all this centralized data and new ways to monitor, analyze, and model network distribution, staff at WASAC have so far accurately mapped and identified water supply issues for around 200,000 households and begun instituting network configuration solutions to ensure a more reliable and sustainable water supply for everyone.

