Over the past 40 years, GIS and remote sensing have gained wide popularity in India, mostly in the government sector. What has been lacking, however, is the use of spatial analytics at the individual level. But a new app, called Agri-GIS, is beginning to bridge that gap in the farming community.

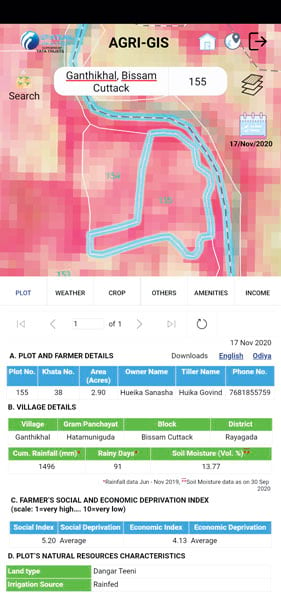
In South Odisha, India, farmers, who mostly own small landholdings, are now using Agri-GIS to make better decisions about their agricultural operations. Starting in June 2018, 150,000 farmers in 532 villages began receiving Agri-GIS advisories that are customized to their plots of land. The advisories, which are transmitted as simple text messages or phone calls, or via a smartphone app, include daily weather forecasts, satellite imagery-based real-time crop and water assessments, crop suitability recommendations based on soil types, market and price analytics, details about agricultural facilities and government programs, and alerts for episodic events such as cyclones. With this, farmers can better figure out which crops work for their land, how to optimize their crop production, best practices for farming, and how to maximize their incomes.
But the unique aspect of Agri-GIS is how it puts the farmer at the center of its analytics. Agri-GIS considers each farmer a virtual economic unit that generates a certain level of sustained economic activity for their family. The app does a 360-degree evaluation of the farmer: their land; social and family characteristics; current and aspirational economic status; noncropping activities such as poultry farming, animal husbandry, beekeeping, and farm labor; and earnings from other endeavors, including dairy and poultry farming or participation in labor trades.
All this is made possible by Agri-GIS’s disaggregated approach to spatial analytics. Using various spatial and nonspatial datasets, the app does a holistic assessment of individual farms, getting at all the direct and indirect variables involved in agriculture rather than focusing strictly on land, soil, and water information. From there, Agri-GIS generates straightforward, personalized messaging that helps farmers get the most out of their efforts, thereby boosting their quality of life.
Data Distilled to the Hyperlocal Level
A big part of what makes Agri-GIS work is that it is innovatively built on advanced ArcGIS capabilities.
For one, distilling multiple layers of images, maps, and other spatial data at the individual plot level requires tremendous skill in spatial data engineering and data analytics. The geodatabases in ArcGIS Enterprise, plus the software’s advanced analytics tools, give Agri-GIS that power.
For example, the imagery the app uses to generate crop status details and land and water information comes from different satellite constellations, including Sentinel-2, Landsat, Planet, and Indian Remote Sensing (IRS) satellites. Also, daily weather forecasts are assembled from different weather services, and GIS maps come from various GIS data services and internal mapping. All this—and more—needs to be brought together and analyzed so the app can issue advisories that include 15-day, village-level forecasts of rainfall, temperature, and humidity; crop recommendations; suggestions for best practices; and income estimates. The app relies on cadastral records to divvy up land units into individual plots. Data for each plot includes ownership details and household survey data that contains information about each family’s demographic makeup, education, social standing, and work status. Each plot’s data also provides GIS maps showing soils, land use, and groundwater potential and data on agricultural facilities, markets, and financing opportunities. These datasets are coregistered in a geodatabase that consists of 104 parameters, making it possible to disaggregate everything so it applies to each plot or cadastre unit and then spatially analyze that to generate advisories for each farmer.

Additionally, every crop season—which, in South Odisha, is split mainly into kharif (June through November or December) and rabi (January through April or May)—the data is updated in Agri-GIS in real time. This means that the app can take all the data it has ever acquired and consistently modify it to apply specifically to each of the 532 villages and 150,000 farmers in the region.
Another way Agri-GIS creatively applies the spatial analytics capabilities in ArcGIS is in reducing complex datasets to simple advisories that are applicable at the hyperlocal level. Employing ArcGIS Spatial Analyst, ModelBuilder, ArcGIS 3D Analyst, ArcGIS Image Analyst, ArcPy, ArcGIS Geostatistical Analyst, and machine learning and artificial intelligence (AI) tools, such as R, Python, and tensors, Agri-GIS performs a profusion of analyses to generate insights about individual plots of land or even a village as a whole. In turn, this becomes part of the intelligence that Agri-GIS employs to do future analysis.
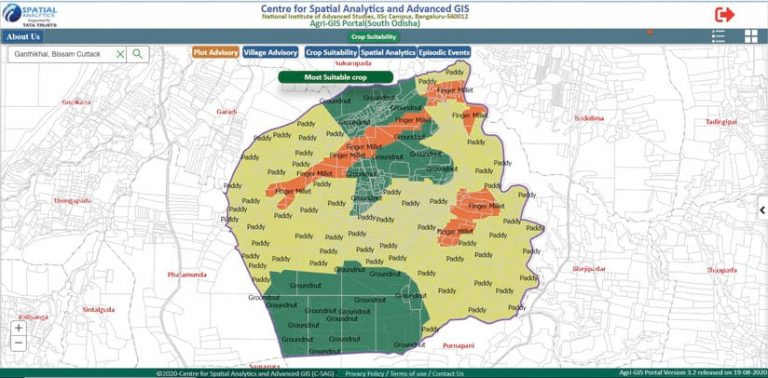
Indexing analytics, for example, determines a farmer’s social and economic status, which helps customize the advisories. High-end image analytics supplies weekly water and crop status reports at the plot and/or village level. Advanced meteorological analytics reduces gridded weather forecasts to the village level—a first for this area. Suitability analyses determine the optimal crops for each plot of land, based on its own soil, climate, and social conditions, and comes up with best practices for crops for every stage of the farming season. Beneficiary analytics determines what benefits, such as income or assets, a farmer can expect to receive. And market analyses recommend the best pricing at different markets. All this is then integrated into up-to-date advisories that farmers receive on a daily basis.

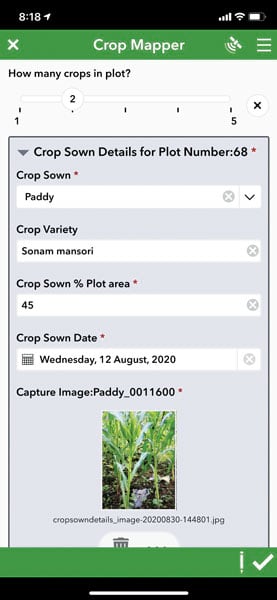
Finally, the Centre for Spatial Analytics and Advanced GIS (C-SAG) has developed 16 different apps that farmers, local researchers, and government officials have access to. Built with ArcGIS Enterprise, ArcGIS Survey123, ArcGIS Collector, and native web app builders, each app serves different Agri-GIS requirements. For instance, farmers can use the Soil Sample Analysis app, the Facilities Mapper app, the Crop Mapper app, and various dashboards to not only see their customized advisories but also update critical crop data and send feedback from the field. Additionally, government officials and agricultural experts have access to an Agri-GIS portal that provides detailed advisory information and other GIS functions, such as crop suitability analyses and seasonable crop maps, that they can use to make high level decisions.
Farmers Feel the Effects
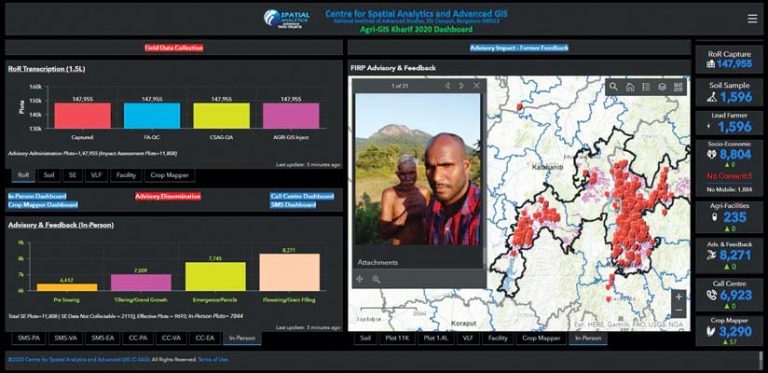
In 2019, C-SAG began to assess whether the advisories were actually getting farmers to heed crop recommendations, adopt more scientific agricultural practices, increase their yields, earn larger incomes, and experience any other social advancements. Using ArcGIS Dashboards, C-SAG developed the Agri-GIS Dashboard to track, in real time, advisory dissemination alongside farmer feedback.
For the 2020 kharif season, C-SAG released four formal crop-stage advisories: a pre-sowing advisory on June 2, a tillering advisory on August 19, a plant emergence advisory on September 21, and a flowering advisory on October 19. Based on a sample of 8,804 farmers, as of November 2, C-SAG had recorded the following impacts:
- Forty percent of farmers adopted crop recommendations from Agri-GIS.
- Ninety-eight percent of farmers rated the village weather advisory as uniquely relevant, meaning they adjusted their activities according to the advisories.
- Eighty-four percent of farmers embraced the agricultural practices recommended by Agri-GIS and sought additional details about them.
- Seventy-eight percent of farmers concurred that their incomes would likely increase to the levels Agri-GIS indicated.

In a separate assessment, C-SAG determined that in the 2020 kharif season, the incomes of the 8,804 farmers who participated in this survey would increase by up to 60 percent against their 2019 incomes. Projecting that out to the remaining 110,000 farmers who have their own plots of land (the rest are government owned), the cumulative income for farmers in South Odisha is likely to increase from 1.38 billion Indian rupees (US$18.6 million) in 2019 to 2.31 billion Indian rupees (US$31 million) in 2020.
C-SAG plans on continuing the assessment through the next two years to make Agri-GIS a more robust product for farmers and, more broadly, bring spatial analytics solidly into India’s agricultural spheres.
App Charts Two New Courses
Looking ahead, C-SAG is planning to take Agri-GIS in two new directions. First, it will work with state governments in India to start implementing Agri-GIS as a public good for small and marginal farmers in rural areas. Second, it will promote Agri-GIS to farmer cooperatives and large agricultural businesses as a pioneering way to support the agricultural supply chain in India.
To find out more about C-SAG and Agri-GIS, take a look at the “International Workshop on Advanced Spatial Analytics and Deep Learning for Geospatial Applications,” presented by C-SAG in January 2020. Video recordings from the event can be found at the International workshop on Advanced Spatial Analytics and Deep Learning for Geospatial Applications.
C-SAG developed Agri-GIS with support from Tata Trusts and the Bill & Melinda Gates Foundation’s India Office, as well as in association with the State of Odisha’s Department of Agriculture and Farmers’ Empowerment. The advisories available through Agri-GIS were designed with guidance from the Odisha University of Agriculture and Technology and various agricultural experts.

