At any given moment in 70 countries around the world, tens of thousands of doctors—independent of any given side in a dispute or government conflict—are helping people suffering through wars; natural disasters; or events that, without medical care, would otherwise prove life-threatening. That’s in addition to the vast number of supplies traveling in thousands of different directions to support these doctors’ missions, as well as the enormous amounts of data that come with tracking every mission’s progress and equipment.
For the organization that manages all this—Médecins Sans Frontières (MSF), translated to Doctors Without Borders—GIS is not just a mapping tool; it is the key to supporting knowledge management. With the organization’s people and operations dotting the globe, decision-makers rely on ArcGIS technology deployed across the enterprise to better understand what resources and assets MSF has and where they’re located, as well as what operations staff may encounter in the field and how MSF can help.
 where, along with areas shown in red stripes that aren’t known to be receiving RUTF.")
In Mozambique, for instance, teams quickly distributed water door-to-door in a densely populated urban area and repaired damaged water lines after Cyclone Idai in 2019. In Bangladesh, the organization planned and managed health services as hundreds of thousands of Rohingya refugees from Myanmar streamed into the country in recent years. In Burundi, a team traveled from house to house to spray mosquito repellant in 2020 to keep malaria from spreading, using a GIS app to organize and monitor the team’s efforts from the very first to the very last residence. And in just 10 days in 2016, MSF vaccinated 710,000 people for yellow fever in Kinshasa, the densely populated capital of the Democratic Republic of the Congo.
These are just a few examples of MSF’s life-saving work in which the organization’s GIS specialists offered key support.
Proving the Value of GIS
Within MSF, it wasn’t always assumed that GIS added value to a mission. It took convincing internal decision-makers, plus time. And it was especially challenging in an organization that relies exclusively on funding from private donors, when many of those funds are dedicated to specific uses such as logistics, medical activities, or relief operations at large.
“In the past, we had to demonstrate our added value. This is done. It’s not an issue anymore,” said Mathieu Soupart, director of the MSF GIS Centre and formerly the organization’s logistics director. Soupart has 30 years of experience with MSF.
The questions now revolve around how—and how much—GIS will grow within the organization in pursuit of helping its overall mission, and how GIS should evolve to respond in an agile way to the organization’s changing operational needs. MSF has been unique in the world of global health because it has strategically adapted its organization and operations to GIS as the technology has evolved.
Founded in 1971 in Paris, MSF has grown to a team of more than 69,000 people who go wherever and whenever needed to assist millions with medical care regardless of their gender, race, religion, creed, or political affiliation. Helping MSF fulfill that mission are about 30 contributors in its GIS Centre, and another 30 or so GIS staff members in the field.
The organization has 749 Creator user type licenses in ArcGIS Enterprise so that users can edit content, create maps and apps, and more. They can also add the MSF presence layer to their maps to show the locations of all the organization’s projects at any given time.
In addition, the organization has 3,613 people authorized to view private content within the portal. There, they can access MSF’s central repository, which contains basemaps, data, apps, and satellite imagery—some of which have been gathered or created for previous missions—that are searchable by country or keyword.
. New cases are denoted with pink circles and cumulative cases are denoted by green circles of various sizes indicating one, five, and ten cases. Yellow information boxes show the name of each district, the number of cumulative cases, how many days it has been since the last case was recorded, and the number of deaths.")
The portal also provides access to data and basemaps in Esri’s ArcGIS Living Atlas of the World, including available land-use and population maps, drought monitors, and imagery for situational awareness and historical assessment. Through the portal, MSF staff can request GIS support for a mission.
Additionally, MSF has 242 advanced users of ArcGIS Pro, which has been crucial for those working in remote areas because of its offline mapping capabilities.
In the beginning of MSF’s GIS journey in 2013, the organization lacked GIS expertise of its own, so it turned to another humanitarian group—French nongovernmental organization and ArcGIS technology user CartONG—to help implement the technology and produce GIS work. A close collaborator with MSF ever since, CartONG has helped make maps, work in the field, conduct trainings, and strategize with MSF on GIS operations within the organization, including map sharing. MSF has since spent more than 10 years growing its own GIS acumen and resources.
The organization restructured its GIS Centre in 2021 and keeps pace with ArcGIS technological advancements. ArcGIS offered MSF a proven and mature suite of integrated, well-documented products to achieve its objectives, as well as a community of users and use cases to learn from.
The technology also gives MSF the level of security that an organization of its size and role requires. Medical confidentiality, for one, is paramount. If any information is shared publicly, such as to support a local health authority, it is shared via controlled channels. Only those who are authorized internally can access MSF’s secure GIS portal.
Becoming a GIS Believer
Soupart first encountered GIS when he served as MSF’s point of contact for the European Union’s Copernicus program—called Services and Applications for Emergency Response (SAFER)—which used satellite imagery to monitor crises and humanitarian needs. He began wondering how the technology might better support MSF’s operations.
“That is how I became one of the first believers in GIS” at MSF, he said.
The humanitarian logistics community was already employing loads of maps, but MSF staff were using existing maps, not making their own.
“It was very clear that we needed maps,” he said, noting the many planes, helicopters, trucks, and other vehicles delivering goods, plus the organization’s need to know how to reach the populations those deliveries were for. “But more than that, we needed to be able to cross-reference layers of information to provide a powerful tool for understanding contexts through appropriate visualizations.”
Soupart envisioned infusing GIS into MSF much in the same way a military equips each of its soldiers with cartographic skills and tools. He wanted to demonstrate, in the field, how valuable GIS could be in supporting MSF’s mission.
In 2012, MSF conducted a study on the potential for GIS to add value to the organization, and in 2013, it created a small GIS unit supported by CartONG, which produced maps for various missions. Not long after, an Ebola outbreak would become one of the first proving grounds for the technology. This accelerated the use of GIS within MSF.
“One super quality of MSF is agility,” said Soupart.
Much of the organization was involved in the Ebola response, including operations, medical care, and logistics—all of which had their own data structures. Trying to grasp and synthesize essential information spread across so many people located in multiple countries in western Africa was a challenge, to say the least. GIS became the information integrator, Soupart said.
-

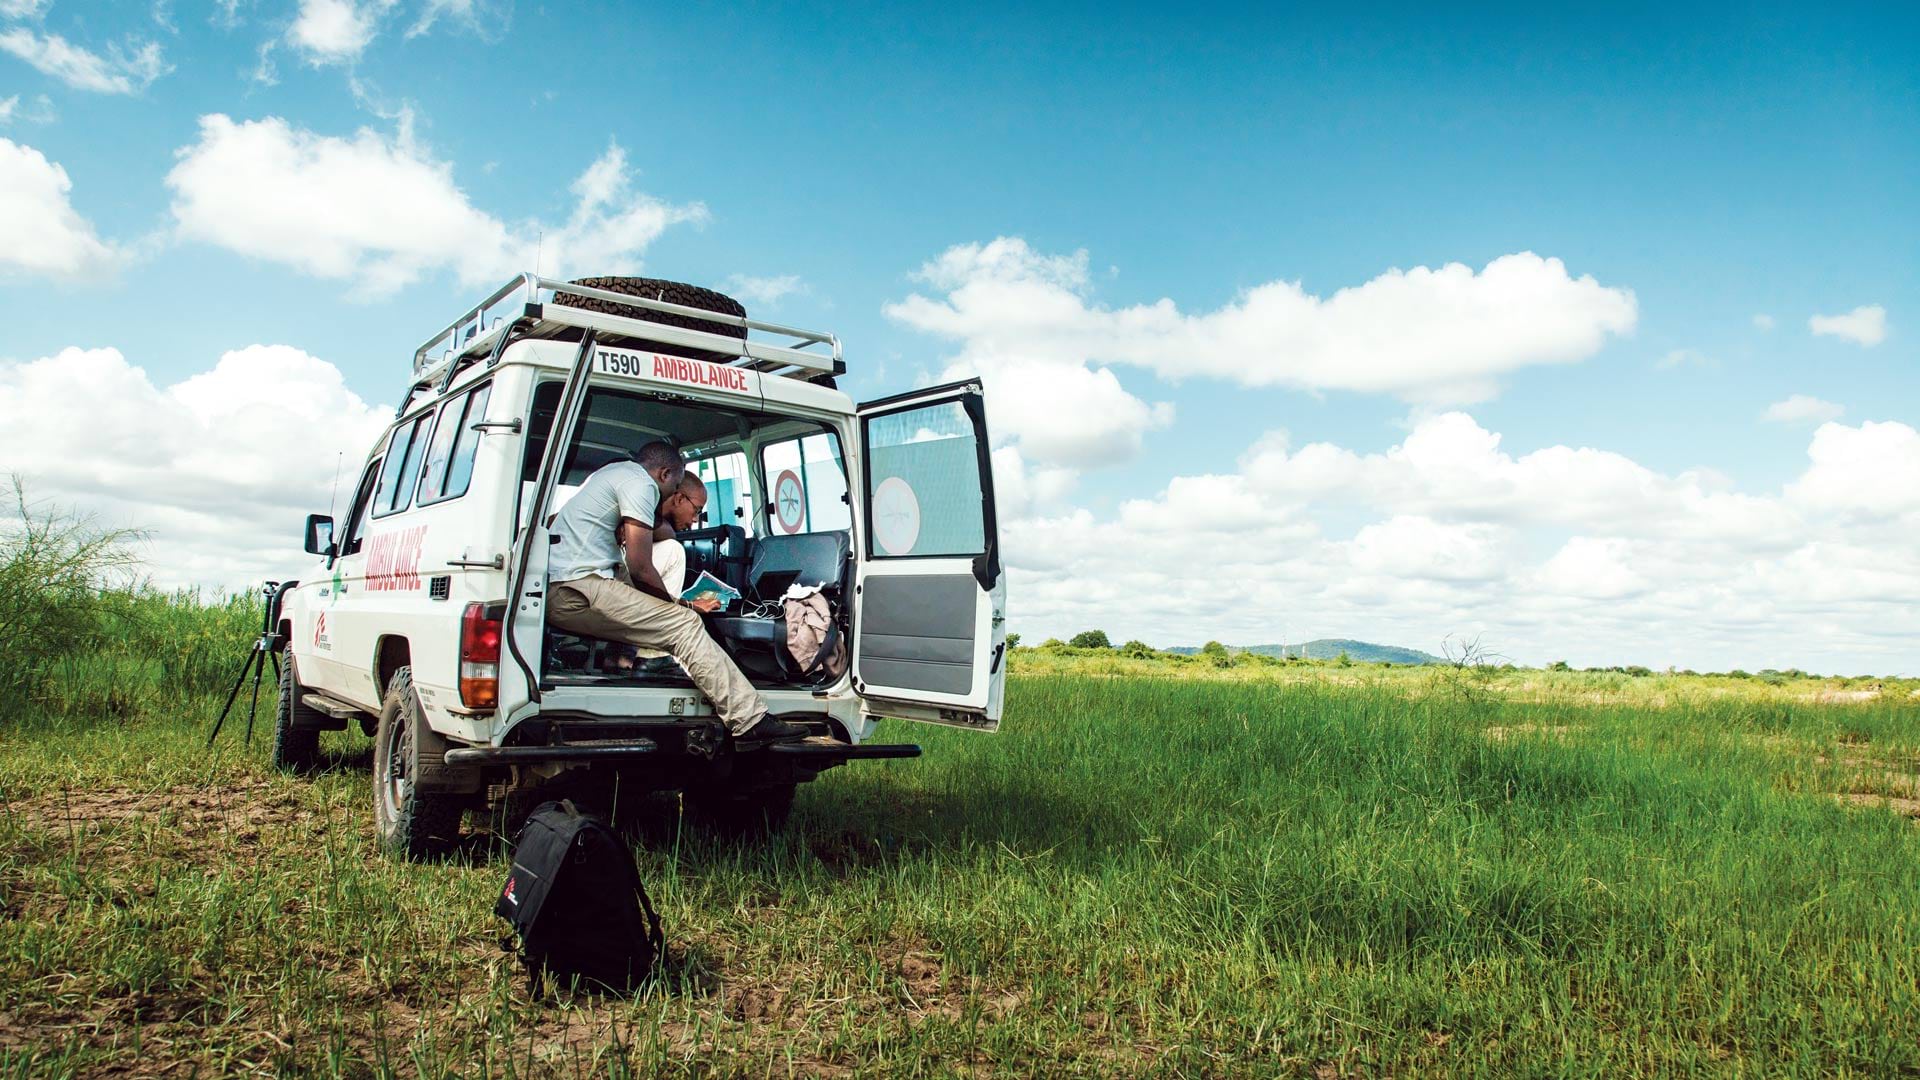
MSF teams go wherever people need assistance with medical care, regardless of their gender, race, religion, creed, or political affiliation.
It was during this crisis that epidemiologists were paired with GIS specialists. It is now common for a GIS specialist to be partnered with an epidemiologist and be among the first deployed to the field for outbreaks such as Ebola.
The Ebola crisis became the moment that GIS went from being used in demonstrations at MSF to being sought out for missions.
“It was this switchover that confirmed to us that our initial intuition was right,” Soupart said: GIS could be a tangible support to the organization’s operations.
The reliance on GIS at MSF grew. As one person was supported by a GIS specialist in one mission, they would ask for a specialist on their next mission. That demand has justified GIS becoming a permanent, systemized service within MSF, which now offers internal training, products, and services to those who would benefit from them.
For GIS specialists in the field and at headquarters, ArcGIS Field Maps and ArcGIS Survey123 have been essential when working alongside epidemiologists to collect information. These apps have also allowed teams to independently assess needs such as the proximity of populations to health facilities for better access to health care.
In addition, MSF’s GIS teams have created other apps with Esri technology, including the organization’s Epimap, which dynamically visualizes multiple regional epidemics for better monitoring. ArcGIS Dashboards helps GIS specialists manage and visualize the gathered information, including where MSF activities are taking place, where there are safe supply routes and readily available radio networks along those routes, and where there are needs in a community for clean water and sanitation.
A Geospatial Strategy for Delivering Health Care
MSF has approached the use of GIS strategically, aligning it with the organization’s operations-focused DNA. Soupart, with his logistics and operations background, is keen on there being relevance to involving GIS in a mission.
“It is not in our strategy, and not in our interest, that GIS become obligatory for every mission,” he said. There must be a need.
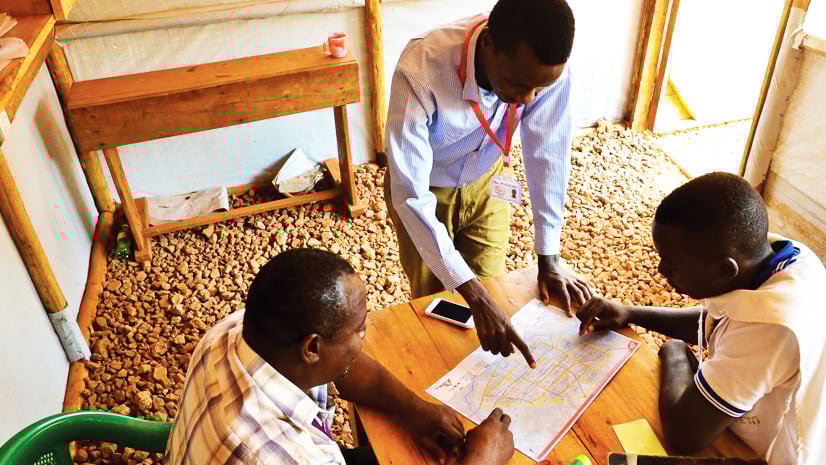
For GIS specialists on missions in the field, the expectation, more than anything, is that they understand the needs of the operations specialists they’re working with and know which map, app, imagery, or data product is necessary to the mission.
GIS support also helps keep MSF staff in the field safe. In-house web apps display deconflicted zones, where humanitarian organizations such as MSF share the locations of their activities with the belligerents to avoid being accidentally fired upon. Other web apps can help make staff aware of nearby risks, such as reports of gunshots and the locations of incidents.

As demand has grown for the GIS Centre’s services, its specialists are being pulled into assisting with data analytics and producing more dynamic geographic products.
The GIS Centre has its own Earth Observation unit, giving the organization a global perspective on where it is operating, whether that’s an urban setting or a refugee camp. Through it, MSF acquired more than 205 images of the earth in 2024 covering 21 countries. The images are being used for flood analysis, damage assessments, population estimates, and overall visual analysis. MSF has also been using deep learning models that extract information from imagery, including buildings.
“The potential benefits of what is possible for AI, deep learning, [and] machine learning workflows is something we are actively looking into,” he said.
Soupart also sees enormous potential in making observations that look at the environmental health of an area. Extreme shifts in weather patterns that have resulted in events such as rising temperatures, more frequent flooding, or prolonged droughts, can quickly turn epidemics into pandemics, Soupart noted.
“Thanks to Earth observation, we can document that and give the proper information to an operational decision-maker,” he said.
There will be, no doubt, no end to the need for MSF’s medical missions around the world anytime soon. As a result, GIS services and support remain in high demand for the organization’s decision-makers and those deployed on MSF missions.