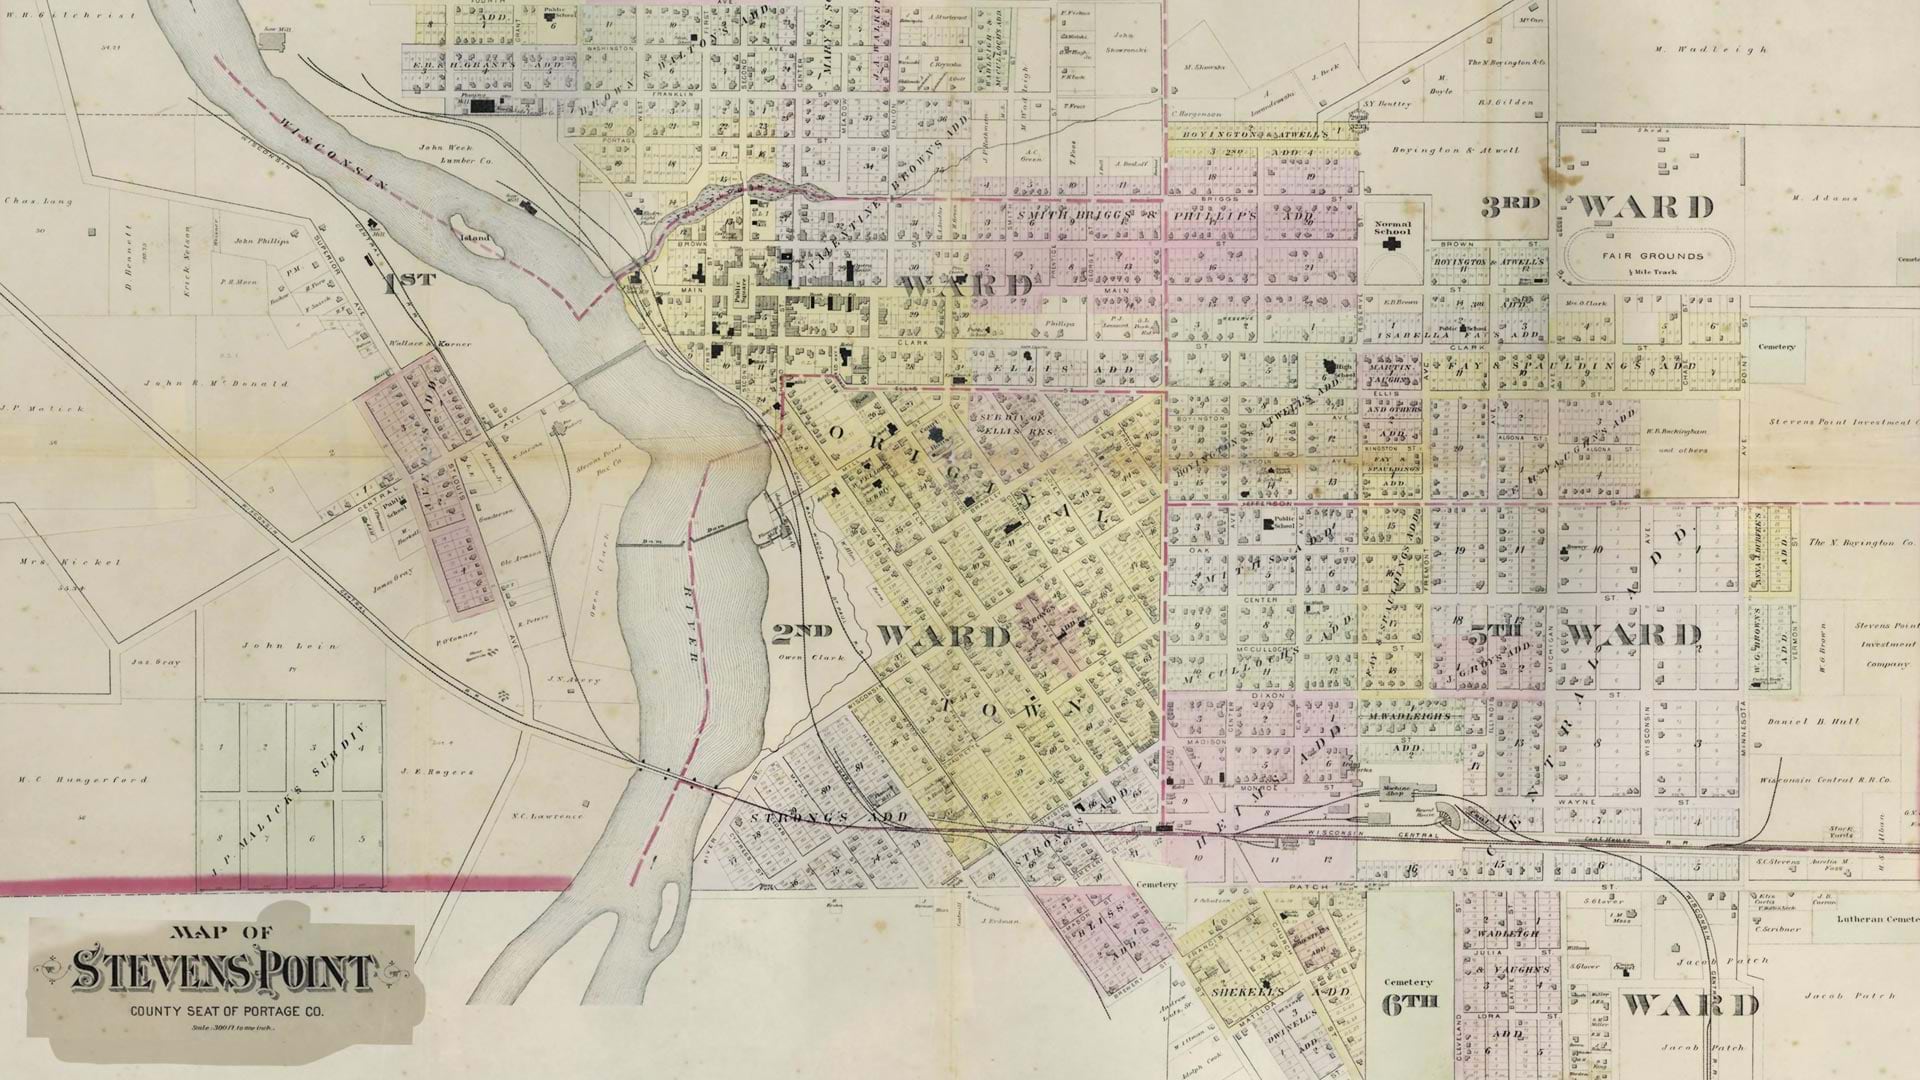
Historical census records are among the richest sources of information about communities, families, and patterns of human settlement. In the United States, decennial census records are released to the public by the National Archives and Records Administration in their entirety after 72 years. But the value they contain is often largely inaccessible, trapped in handwritten tables and stagnant archives.
At the University of Wisconsin–Stevens Point (UWSP), a collaborative effort has transformed these static records into dynamic, interactive geographic data.
The project’s roots stretch back to the 1980s. Using historical census data from Stevens Point, Wisconsin, Japanese anthropologists Toshiyuki Sano and Mariko Fujita examined ethnicity, cultural identity, and perceptions of “authentic” American life in the Midwest. Their work, including compiled 1850–1930 census records, was later donated to the UWSP Archives.
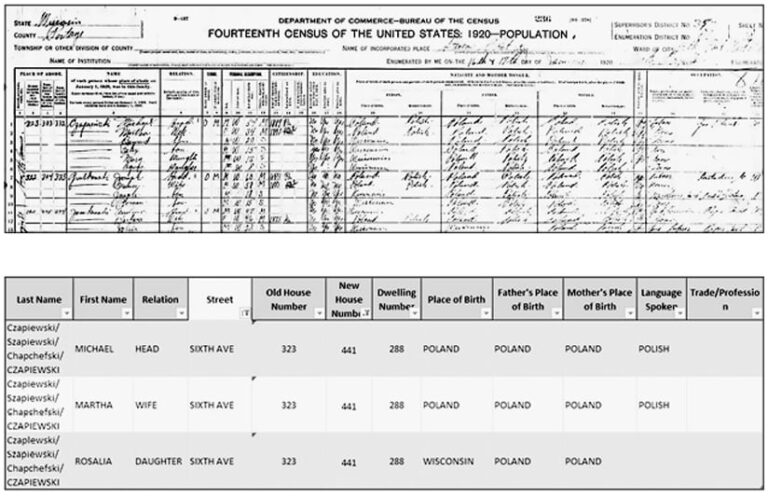
Now, Archives staff have partnered with the UWSP GIS Center to transform these static records into geospatial data capable of being analyzed, visualized, and presented as a story of immigration and settlement.
By integrating archival research with tools such as ArcGIS Pro, ArcGIS Online, ArcGIS Experience Builder, and ArcGIS StoryMaps, UWSP researchers have been able to get a more comprehensive look at the records of the past, revealing new patterns and insights that breathe life into dormant geographical stories.
Drawing Stories from Records
The task of bringing static archival records to life is no small feat. Between manually processing thousands of individual records, sifting through obsolete street names and addresses, and parsing out inconsistent spelling of surnames, the UWSP team had its work cut out.
So the team followed a structured, five-step process to turn census information into standardized geographical data. This included transcription, geocoding, geospatial analysis, cartographic visualization, and storytelling.
Transcription
The first step was locating, verifying, and digitizing the historical census records.
US census data is released to the public with original street addresses. While some records were available through public genealogy platforms, the work often required manually transcribing an image or microfilm of original data into a digital table.
-
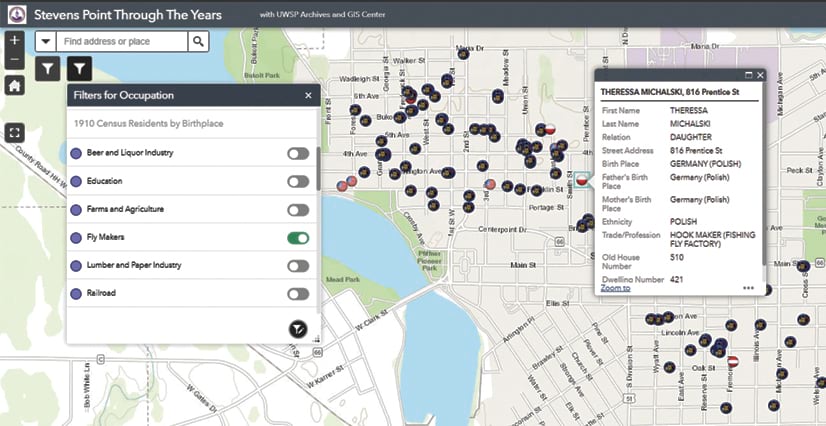
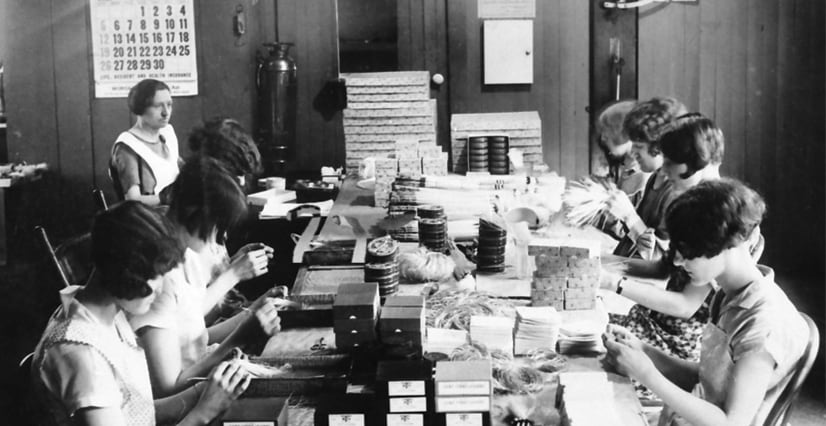
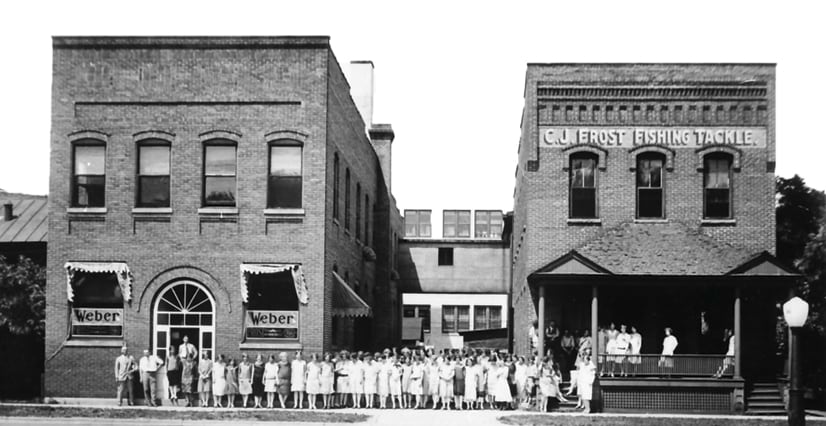
Mapping the residences of CJ Frost Fishing Tackle Manufacturing Company employees reveals patterns that aren’t apparent in census records.
Other transcription complications arose. In some records, for instance, researchers noted a mysterious data artifact: respondents with Polish ancestry noted multiple places of birth. The reason proved elusive, until a look at the historical map revealed that Poland as a country, which had been there when those individuals were born, no longer existed during the decennial census when the question was posed.
To improve accuracy, the team cross-referenced census entries with city directories, newspapers, and obituaries, ensuring names were correctly interpreted and locations were set to present-day street addresses.
Geocoding
Once transcribed, validated street addresses were transformed into geographic coordinates. Geocoding allowed each census record to be placed on the present-day map, linking historical data to a current geospatial framework of street, city, state, and zip code. This was done using geocoding tools in ArcGIS Online and an address locator from the Portage County Planning and Zoning Department.
The geocoding process introduced new complexities. Some houses and addresses no longer existed. Some regions were converted from residential dwellings to other land uses, including parking lots. With no modern-day geographic placeholders for these records, these data points had to be estimated using historical maps or discarded.
Geospatial Analysis
With the data geocoded, the team used ArcGIS Pro for advanced analysis. Researchers were able to answer new questions: Where did residents originate during that decennial census? How were immigrant communities distributed across the city? Which individuals migrated the greatest distances?
Geospatial analysis revealed patterns about population density, distribution of communities of various ethnicities, and other factors that were otherwise invisible without geographic context.
Cartographic Visualization
Using ArcGIS Pro and ArcGIS Online, the team designed maps that communicated this context. Census attributes such as place of birth were symbolized to create intuitive, visually engaging maps.
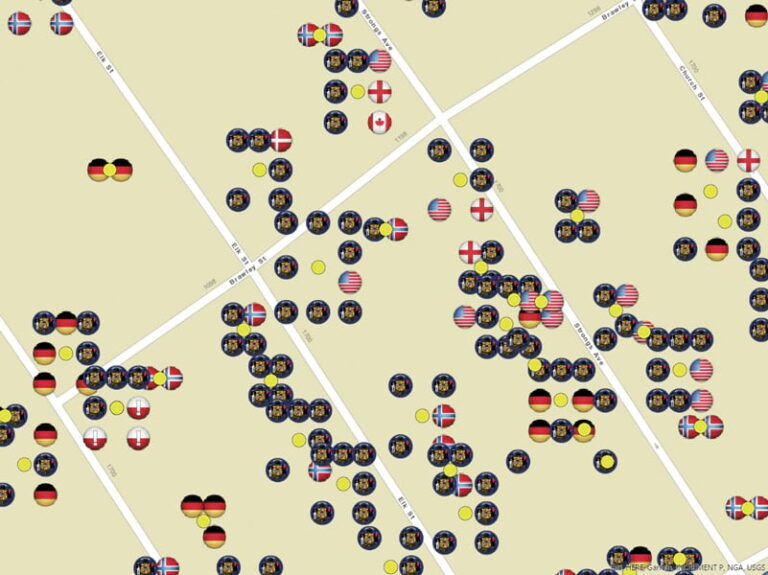
Here, the team had to figure out how to represent overlapping data points and diverse countries of birth. The Disperse Markers tool in ArcGIS Pro identified overlapping point symbols representing individuals at the same residence and separated them into a clear pattern centered on the associated household. Birthplace diversity was represented with custom picture markers based on country, and in some cases, city flags. This approach created unique, easily distinguishable markers for each represented birthplace.
Storytelling
Historical storytelling was the project’s central ambition—a way to turn historical data into a tangible representation of lived experiences. The team used ArcGIS StoryMaps to weave spatial data and local history into human-centered insights.
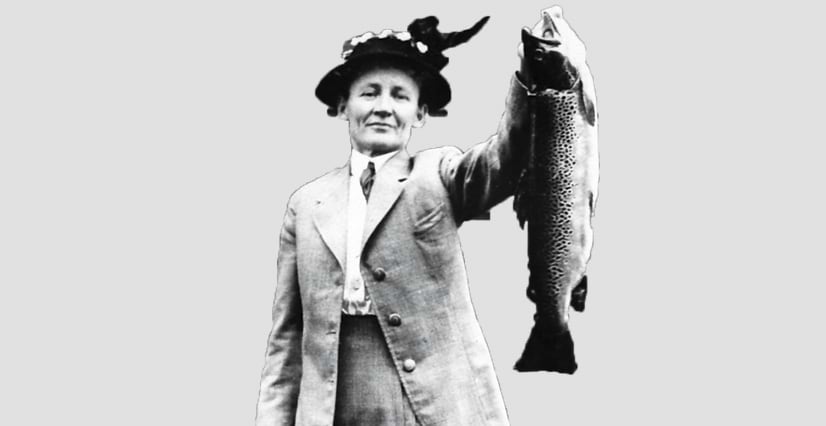
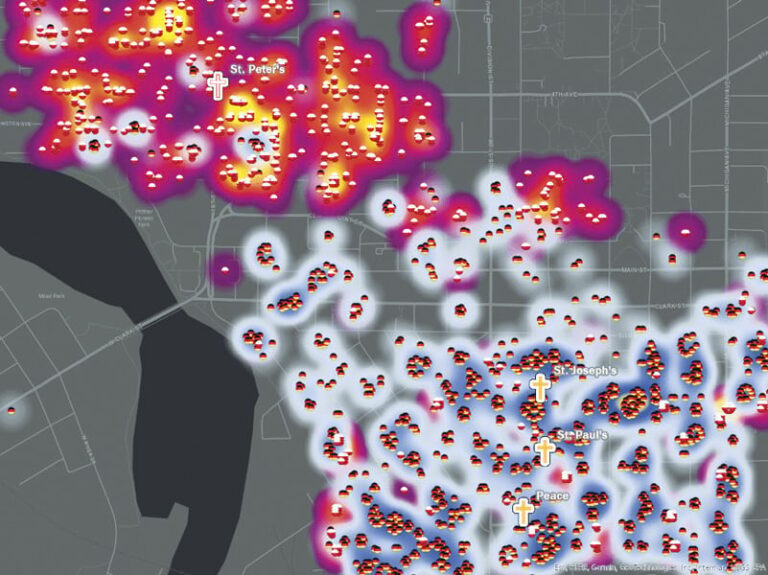
For example, an industrial history emerges through mapped employment patterns, such as the female workers tied to Carrie Frost’s fishing tackle company. The team also put together stories about the clustering of the Polish community on Stevens Point’s north side and the German community on the south side, and the anchoring of community identity around religious and cultural landmarks, such as St. Peter’s Catholic Church.
The historical census contains countless stories, yet the example narratives presented by the UWSP team are limited to their interests and interpretations. Using ArcGIS Experience Builder, the team also created interactive tools allowing visitors to explore and filter data to tell stories of their own. These tools bridge the gap between traditional archival research and modern spatial analysis.
Seeing the Past in a New Way
This project illustrates how GIS can transform static records into dynamic stories—a capability available to every community with access to historical census data. By linking peoples’ stories with the places they lived and worked, GIS reveals patterns and culturally connected narratives that enrich our understanding of the past and make history accessible, engaging, and relevant.
Historical census data doesn’t need to be confined to an archive. When it is mapped and shared, it comes alive.