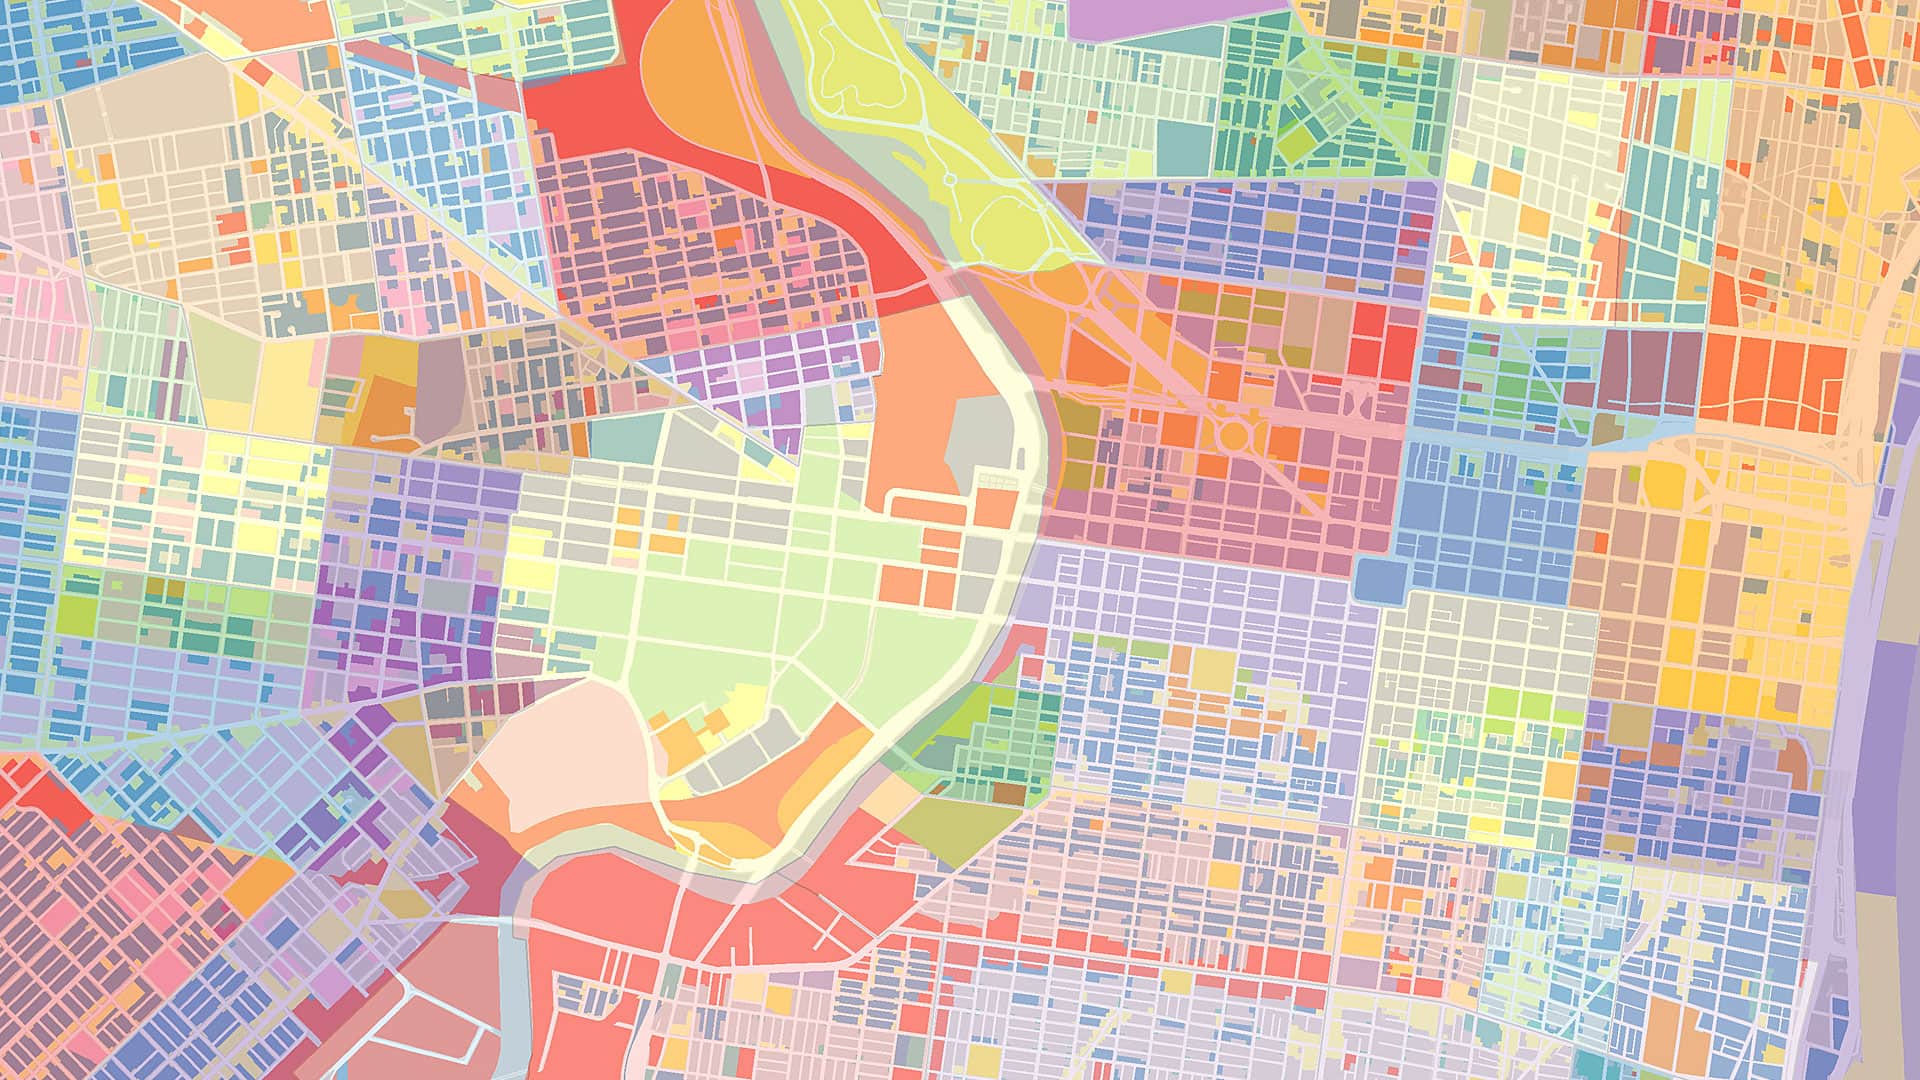
Imagine walking into a concert hall. The orchestra is seated. The conductor raises the baton, and within seconds you can distinguish the melody from the harmony, the rhythm from the counterpoint. You do not consciously analyze each note; everything fits together. The music guides you. It tells you where to focus, when to expect change, when to relax, and when to be surprised.
Now imagine opening a map. At first glance, maps and music appear to have little in common. One speaks to our ears, the other, in many cases, to our eyes. One unfolds over time, the other seems frozen on paper or static on a screen. Yet perhaps they are more closely related than they seem. What if every map has its own soundtrack? What if the best maps are not only seen but also heard?
The comparison is more than a metaphor. It reveals something fundamental about how maps work.
Every piece of music begins with rhythm. Rhythm provides structure, repetition, and expectation. Without it, music is difficult to follow.
Maps have rhythm, too. Think of a city map. Streets repeat at regular intervals. Building blocks establish patterns. Contour lines create visual beats across a landscape. The spacing of labels guides the eye naturally across the page or screen. Good cartographers know that visual rhythm helps readers navigate almost subconsciously. Bad rhythm creates visual noise.
Then comes the melody. The melody is the part of a song we remember. It stands out from everything else.
Maps also have melodies. The route highlighted on a navigational map. The river winding through a valley. The migration path crossing continents. The thematic symbols revealing the spread of a disease or the distribution of renewable energy. Every successful map has a visual melody—the element that immediately attracts viewers’ attention and tells the story.

Everything else supports the melody. In music, harmony enriches the melody without overwhelming it. Chords create depth and atmosphere, providing context.
The same happens in cartography. Background colors, terrain shading, subtle administrative boundaries, vegetation, and water bodies often remain in the background. They’re rarely the focus of the map but help the central message make sense. Without harmony, the melody sounds empty. Without context, the map loses meaning.
Dynamics play another crucial role. Through crescendos and decrescendos, music constantly changes volume. Some passages whisper, others explode. These changes elicit emotion and direct listeners’ attention.
Maps also use dynamics—visually rather than acoustically. Contrast, color intensity, line width, transparency, topography, and symbol size all determine what appears loud and what remains quiet. A bright red line demands immediate attention, while a pale gray road quietly supports orientation. Skilled cartographers compose these dynamics carefully. Not everything can be loud at the same time. If every instrument plays fortissimo, the audience hears only noise. If every map symbol is bright and bold, viewers see a mess.
Tempo offers another parallel. Music can be fast or slow, energetic or contemplative.
Maps control pace, too. A clean tourist map enables quick decision-making. An atlas encourages exploration. A historical map invites careful reading. Interactive digital maps let users control the tempo themselves by zooming, filtering, or revealing additional layers. Good cartography doesn’t simply provide information; it controls the speed at which information is discovered.
One of the strongest parts of the analogy lies in orchestration. An orchestra consists of dozens, sometimes hundreds, of individual musicians. Each instrument has its own characteristics, strengths, and limitations. None is inherently more important than another. Success depends entirely on how they play together.
Maps are orchestrations of graphical elements. Points, lines, polygons, colors, labels, textures, diagrams, legends, and scale bars all perform different roles. A map where every element competes for attention resembles an orchestra where every musician insists on playing the solo. Technically impressive, perhaps, but impossible to enjoy.
Good cartography, like good music, requires restraint. Silence is important. The greatest composers understand that silence is not the absence of music—it is part of the composition. A pause allows listeners to breathe and creates anticipation.
Maps also need silence. White space is often misunderstood as unused space. In reality, it offers visual breathing room. Empty areas separate information, clarify structure, and reduce cognitive load. Many beginners try to fill every corner of a map with information. Experienced cartographers know that sometimes the most important part of design is deciding what to leave out.
Perhaps this is where cartography and music are most alike. Neither is simply about transmitting information. A musical score contains notes, but music emerges only when they are interpreted. A map contains geographic data, but spatial understanding emerges only when someone reads it.
Both require composition. Both require interpretation. Both depend on balancing complexity with simplicity.
Interestingly, neither discipline aims for perfect realism. A symphony does not reproduce every sound in nature. It selects, arranges, exaggerates, simplifies, and structures sound to create meaning.
Maps do exactly the same thing. They are not mirrors of reality. They are carefully designed interpretations of reality. Every mapmaker decides what to include, omit, emphasize, and suppress. In that sense, every map is a composition.
Today, AI tools can generate maps in seconds. Algorithms can optimize layouts, classify imagery, and personalize visualizations for different users. Yet AI struggles with something musicians know instinctively: timing, balance, expression, and emotion.
A technically correct musical performance is not necessarily a beautiful one. The same is true for maps.
The future of cartography may resemble the role of a conductor rather than that of a drafter. Cartographers increasingly guide intelligent systems instead of drawing every line themselves. But their responsibility remains unchanged: ensuring that every visual element contributes to a coherent whole.
The next time you unfold a map—or design one yourself—try asking a new question. Not, “How does it look?” Rather, “How does it sound?”
Does your map have rhythm? Is there a clear melody? Are the supporting voices balanced? Does it whisper when it should and shout only when necessary? Does it leave enough silence between the notes?
Because the finest maps are like the finest music: They resonate long after we have stopped looking at them.