The United States Census Bureau’s International Database (IDB) is a vital resource for understanding global demographic trends. Built in 2009, this interactive demographic data visualization tool provides comprehensive population estimates and projections for 227 countries and nearly 17,000 subnational areas worldwide.
Making regular updates to the IDB is essential to ensure that users have access to the most current and accurate data on ever-changing global population characteristics. Early on, the tool pulled from various technologies, but in 2011, Esri partner The Coleman Group, Inc. was brought in to provide technical assistance and contribute to the IDB’s evolution. Since then, the experienced federal government contractor has collaborated with the Census Bureau to integrate the latest developments in apps and Esri technology, creating robust analytical tools for the IDB’s international audience.

Understanding Global Demographic Data
Global demographic data is essential for understanding the world. The data provides critical insight into population trends, age distributions, migration patterns, and more—empowering policymakers, economists, and public health officials to make informed decisions.
Both the US Census Bureau and the United Nations estimate and project global population figures. Since the 1960s, the Census Bureau has provided data for more than 200 countries, and recently, it expanded its projections to include subnational areas equivalent to counties in the United States. Detailed population estimates and forecasts by age and sex for 2015–2030, along with national projections extending to 2100, can be accessed through the IDB on the Census Bureau’s website.
Using such detailed and wide-ranging demographic data can be challenging, though. It requires reliable data sources and practical analytical tools. Moreover, to present audiences with engaging and valuable narratives based on the data, analysts need a suitable technical framework and appropriate, modern tools.
This is what the IDB ultimately provides. For the past 14 years, app developers and GIS professionals from The Coleman Group have collaborated closely with Census Bureau staff to develop and enhance the configurable platform, ensuring that it delivers useful data products to the public. ArcGIS Pro, ArcGIS Enterprise, ArcGIS Online, and other technologies are key to fulfilling this mission for the Census Bureau and achieving its data dissemination goals.
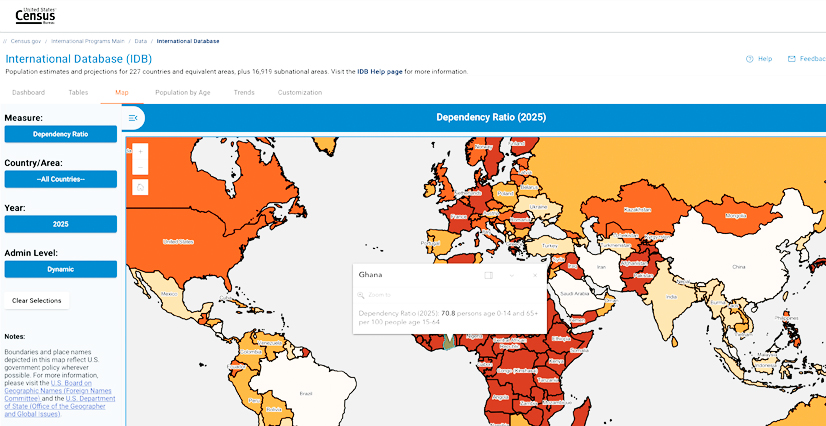
 webpage. The page features a demographic overview of countries, displaying data like population, growth rate, fertility rate, life expectancy, and median age in a table format. A sidebar provides options for customizing the report.")
Making Data Delivery Efficient
To meet rising demand for accurate and timely data delivery, the IDB needs continuous improvement. Over the years, The Coleman Group and the Census Bureau have used various technologies—from standalone databases, ArcGIS Viewer for Flex, and Adobe Flash to ArcGIS Online, ArcGIS Enterprise, and ArcGIS Pro.
A recent iteration of the configurable platform employed the Esri Leaflet plug-in to ingest and display maps from ArcGIS Server, the back-end server software component of ArcGIS Enterprise that makes the Census Bureau’s geographic information available. Initially, the team created map services by merging demographic data with a world feature layer polygon and publishing a Web Map Service from the ArcGIS Pro environment. While this was effective, the process was time-consuming and complex, involving multiple data deliveries and joins with the polygon. A more efficient method was needed to create map services with each data delivery update.
The teams found a solution in implementing the Census Bureau’s Census Data API, vector tile services, ArcGIS Maps SDK for JavaScript, and ArcGIS Arcade.
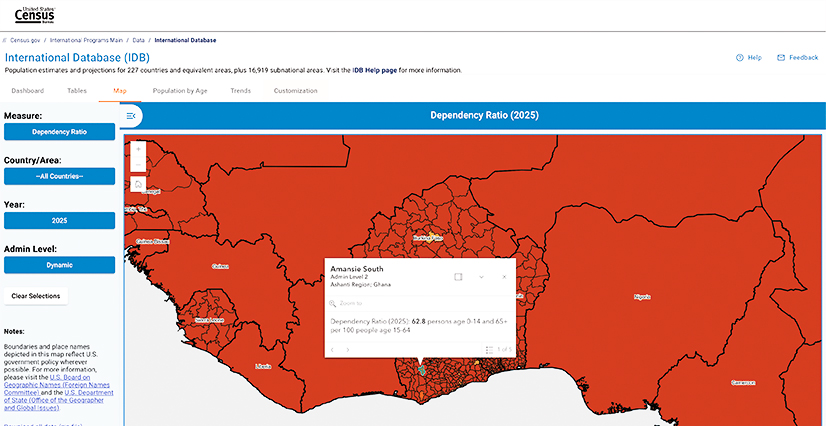
 website showing a population map for Afghanistan, India, and Pakistan for the year 2025. The map visualizes population density with varying shades of color. A sidebar allows users to filter data by measure, country/area, year, and administrative level.")
Enhancing Map Service Performance
Team members from The Coleman Group identified the Census Data API as a viable solution for data delivery. Using the API as a single data source increased efficiency by reducing the number of required data deliveries and improving data integrity. They could use already published feature layers without data, programmatically join the API data, and style features on the client side.
While using the Census Data API addressed several data delivery issues, it negatively impacted map service performance. This was due to the size and detail of the hierarchical geographic boundaries that define political or administrative regions across the globe.
These boundaries are typically organized into levels, each representing a different scale of administrative division. The detail in the countrywide boundaries—administrative level 0—hindered Web Map Service performance at various zoom levels. Additionally, the boundaries for subnational geographies such as states and counties—administrative levels 1–4—were created with similar precision and detail. This meant that boundary generalization wasn’t an option because it would have caused the boundaries to become misaligned.
To remedy this, the team chose vector tile services for map service delivery. Vector tiles are small, performative, and fast to load, allowing users to smoothly zoom and scale boundary outlines without losing detail. The Coleman Group also selected JavaScript Maps SDK to build the app to enhance its performance and functionality.
 page displaying population pyramids. Afghanistan and India are selected, showing the distribution of population by age and gender for the year 2025. The graphs are displayed with blue on one side, and pink on the other.")
Implementing Multiscale Vector Tiles
The Census Bureau’s International Population Division uses the Large Scale International Boundaries dataset from the US Department of State as the basis for its country layers, which incorporate subnational geography. The team from The Coleman Group prepared and improved map service performance by creating the world country layer as a custom vector basemap. This map service, which features US government-approved names included in JavaScript Object Notation (JSON) files, allows for dynamic styling and zooming into selected areas without redownloading the entire layer.
The vector tile service performed very well. However, as users zoomed in, the remaining Web Map Service–based administrative levels rendered slowly. So the team decided to create multiscale vector tiles that dynamically adjust to all zoom levels.
At first, the server couldn’t complete the map rendering process. Detailed administrative boundaries were the source of the issue. The overlapping country boundaries consumed excessive server resources, which slowed down the map service. Because generalizing the boundaries would’ve caused misalignment among administrative levels, the team used the Remove Overlap tool in ArcGIS Pro to create a single shared boundary for the various administrative levels. The boundary was then published as a vector tile service.
-
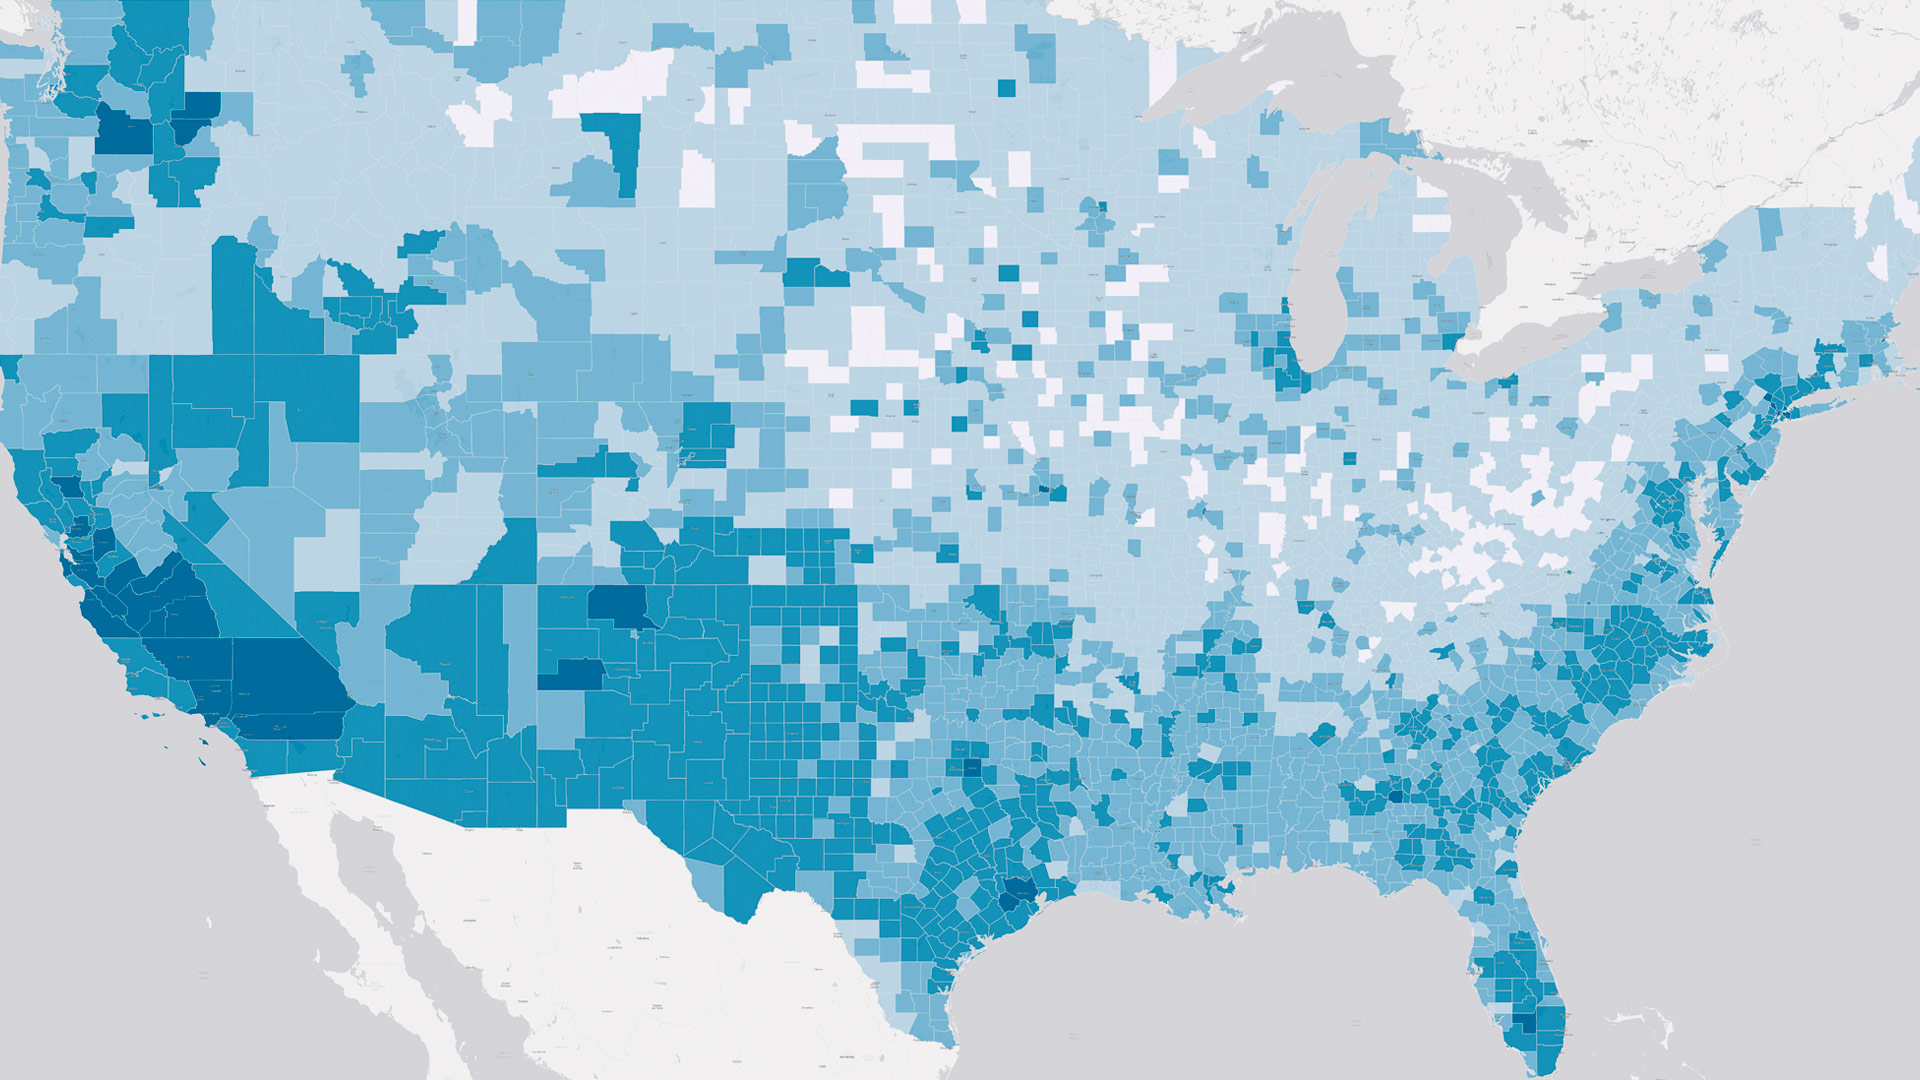
When users select data to measure at subnational levels, the map server loads four image layers corresponding to each administrative level.
Rendering Subnational Data Smoothly
Data is not stored in the vector tiles. Instead, the team associated geometries with country identifiers by creating a unique style layer for each country and putting the country identifiers in the layer attributes. A transparent layer overlaid the vector tile layer, allowing the team to utilize pop-ups from JavaScript Maps SDK to show the country name and data value. Arcade expressions, Esri’s lightweight scripting language, supplied the information.
When a user selects a data measure for subnational areas—such as population, youth or old-age dependency ratios, or the sex ratio of the population—the map server loads four image layers corresponding to each administrative level. Since the API does not provide subnational data for every country, the app ingests the available information, and the map server renders it using the manual breaks provided.
By default, these layers are visible at progressively higher zoom levels. Once a layer is displayed, it remains visible even when overlapped by another layer while zooming. This functionality offers two advantages. First, at the highest zoom levels, users can view the most detailed subnational maps available for a country, which may correspond to administrative levels 2, 3, or 4, depending on the location. Second, when a pop-up appears, all layers are included, meaning that if a user is viewing administrative level 4, they will also see levels 3 and 2. Additionally, The Coleman Group provided tools to turn off this dynamic subnational layering, allowing users to constrain it to a specific level.
 interface. The \"Customization\" tab is selected, showing options to create custom regions by selecting countries/areas from a list, with Albania and Algeria currently selected. Options for creating and managing these regions are also visible.")
Embracing Emerging Technologies
While the IDB may not be the first app to use vector tile services, the team from The Coleman Group is confident that the processes it implemented with the US Census Bureau can be replicated for similar public and private projects.
Many technologies go into building apps that can respond and adapt to technological advances, and it is imperative to evaluate new and upcoming technologies to create workflows that generate modern apps and keep them consistently updated. With the rise of AI, for example, The Coleman Group has initiated an in-house project to help team members enhance their knowledge and skills in this area. The company also recently partnered with several private firms to launch an AI initiative to transform how health-related data gets analyzed and can generate actionable insight. The next step for The Coleman Group is to integrate AI into its app development process alongside GIS technology to enhance data analytics and address its clients’ various areas of interest.