
Cities have a lot of responsibility, from managing public services to engaging with citizens. When they need help with GIS—either improving on existing technology or implementing whole new systems—many of them opt to work with Esri partners. Find out how two cities and one local utility got assistance from Esri partners to upgrade their geospatial technology and streamline their processes.
A Smart Way to Manage Parks
Broken Arrow, Oklahoma, has more than 800 acres of land designated for public use, including 38 parks. Families can access a variety of recreational opportunities in green spaces, and the city is working on building a large-scale, 165-acre park to use for events and festivals.

With a growing population and an influx of activities, the City of Broken Arrow needed a comprehensive management solution for its parks and recreation department. City staff members wanted to ensure that they were adequately tracking, analyzing, and using data about parks, their recreational users, and community involvement. They also wanted to more efficiently perform management functions related to parks planning, operations, policy making, social equity, and social economics.
Geographic Technologies Group, or GTG, has been the city’s main GIS consulting services provider for more than 10 years, so the parks and recreation department was eager to implement GTG’s GreenCityGIS, a bespoke GIS-based solution that introduces smart parks technology. GreenCityGIS helps users geoenable park assets, integrate park-use databases, monitor asset repairs and replacements in real time, and measure and analyze both asset and user data. The solution is composed of three main steps: designing and creating a parks geodatabase, performing an on-site inventory, and developing custom apps.
After GTG built a geodatabase for the City of Broken Arrow, staff from both GTG and the city used Collector for ArcGIS to inventory all park assets, including benches, playground equipment, trees, and light fixtures. They recorded the location of each asset, plus custom attributes such as the manufacturer (if relevant), its current condition, maintenance dates, and photos. Now, with all that data in the geodatabase, staff can make quick, educated, and accurate decisions.
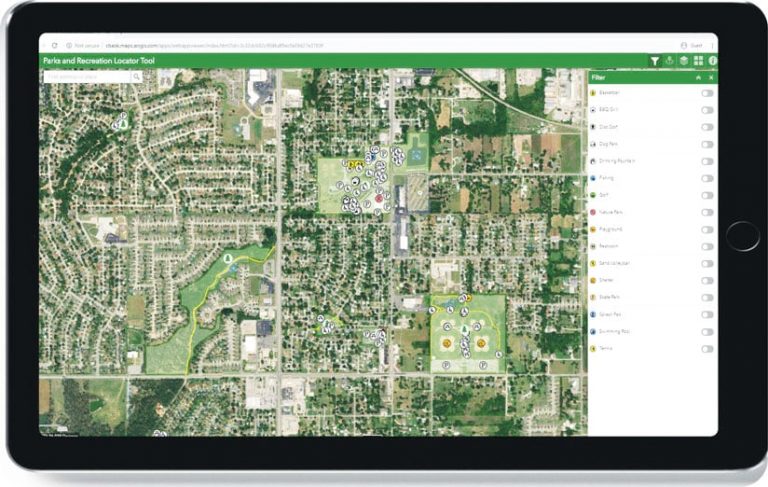
Once all 38 parks were inventoried, GTG developed and deployed four ArcGIS technology-based apps. The first two, built using Web AppBuilder for ArcGIS and ArcGIS Dashboards, are internal apps that allow parks department employees and other city stakeholders to view both historical and real-time data about city parks and their assets, recreational users, facilities, and more. These two apps help streamline decision-making and increase operational efficiency. The other two apps, a park locator and a story map, are public facing and allow users to quickly search for, query, and visualize Broken Arrow’s city parks. The idea is to improve community engagement and strengthen people’s awareness about parks.
GreenCityGIS and the four GIS-based apps that GTG built have revolutionized how the City of Broken Arrow manages its parks, both internally and externally. With their user-friendly and informative experiences, the solutions have improved communication among city staff members and with citizens—and this should pay dividends for years to come.
Using Satellite Data for Water Main Inspections
In Wisconsin, satellite data is helping Green Bay Water Utility (GBWU) do water infrastructure maintenance more quickly and efficiently. But switching from manual surveying methods to using satellite imagery would have been anything but easy if not for the help of POWER Engineers, Inc.

Previously when GBWU needed to survey its underground infrastructure, the 120-year-old utility hired a contractor to use special equipment to listen for leaks in every inch of its distribution system. Because the system was so large, with approximately 450 miles of distribution main, 36,000 service pipes, and 48 miles of supply mains, the contractor could only cover about 20 percent of the utility’s pipes per year. On average, about 1 percent of the area the contractor surveyed ended up having a leak that required further investigation and possible repair.
In March 2019, GBWU started using satellite data provided by Utilis that identifies leaks by detecting treated water in places where it shouldn’t be. This enabled the company to locate four times as many leaks than it could have with its previous ground-surveying method. But this was the first time the utility had received satellite imagery, so to get it to work with its GIS, POWER had to transform the data. In part, this meant projecting the satellite data to match Brown County’s coordinate system.

Working with GBWU, POWER also implemented ArcGIS Dashboards to give the utility new ways to monitor its leak data. Additionally, POWER established new procedures in GBWU’s existing asset management system from Cityworks so the utility could more efficiently identify leaks and make plans to fix them.
Last spring alone, satellite imagery helped GBWU identify 207 points of interest scattered throughout its entire system that showed excess treated water in places that should only contain groundwater, rain, snow, or surface water. These hot spots, as GBWU operations manager Brian Powell refers to them, cover 1,000 feet of water main, or about 11 percent of the system. In the past, it would have taken GBWU at least six months to monitor this much of the system.
Not only has GBWU’s new maintenance approach detected more leaks, but it has also reduced how often field crews have to go out to do leak detection by 5 percent.
Fully Embracing Enterprise GIS
The City of Bloomington, Minnesota, home to the Mall of America, has been using GIS for more than 20 years, but the platform it was on didn’t offer the support the city needed to share data and enhance collaboration. In 2016, the city teamed up with Pro-West & Associates, Inc., to make a full—and extensive—transition to the ArcGIS platform. The firm offered the spectrum of GIS capabilities the city needed to move from its legacy system to industry-standard Esri technology. Key to the transition was implementing enterprise GIS along with a set of mobile GIS solutions.

The changeover happened in phases. First, the City of Bloomington signed an enterprise agreement (EA) with Esri, which gave the local government uncapped access to certain ArcGIS software and expert assistance as it scaled up its GIS. Then Pro-West designed the system architecture, developed data conversion standards, created a geodatabase, configured ArcGIS Enterprise, implemented ArcGIS Online, ensured data and network security, deployed Portal for ArcGIS, integrated various property and asset management systems, and trained employees on how to use the new tools. With the City of Bloomington’s enterprise GIS implementation fully deployed, Pro-West continues to make recommendations on keeping it up-to-date.
Now, the city has all its data in one central, secure location. Together with Pro-West, it has built more than 20 task-driven solutions for use by city staff and the public. Its ArcGIS organization has more than 250 named users; and staff members from a range of departments, including field crews, are well trained in how to use the GIS apps and tools at their disposal.

The City of Bloomington can now fully embrace the benefits of a modern enterprise GIS. It is well positioned to incorporate new tools and capabilities as emerging GIS technology becomes available, and it can easily scale up to support more data, new users, and any major developments in the Bloomington community.
“Pro-West understood our vision, and it proved this by identifying and delivering the solutions that would allow us to achieve that vision,” said Bob O’Neill, the City of Bloomington’s GIS analyst. “Those solutions have exceeded our expectations and taken us further than we thought we could go. The team is a true partner to the city.”