From vanishing forests in Central Europe to shifting agricultural patterns across continents, Earth’s surface tells stories of environmental change that unfold year after year. Bearing witness to these chronicles are high-resolution land-cover maps, which decision-makers in many sectors and around the world use to understand land-use planning, resource management, surface water availability, food security, and more.
Esri is releasing updated global land-cover maps that extend the record of how the planet’s surface has transformed since 2017. In addition to this data’s being available in ArcGIS Living Atlas of the World, users can access it in a web-based app—Esri’s Sentinel-2 Land Cover Explorer—which provides dynamic viewing and analysis capabilities.
“Anybody can drill in to a location of interest anywhere in the world to conduct analysis and gain a global perspective,” said Robert Waterman, who leads the ArcGIS Living Atlas of the World imagery team at Esri.
A Growing Temporal Record
Esri released 2025 data for its Sentinel-2 10m Land Use/Land Cover Time Series in partnership with Impact Observatory, which provides AI-powered geospatial monitoring and on-demand data for environmental risk analysis. The update extends the dataset to eight consecutive years, from 2017 through 2025. Annual updates like this use the same deep learning methodology across all years to help ensure reliable comparisons.
“The more time slices we add, the more valuable it gets,” said Waterman.
-
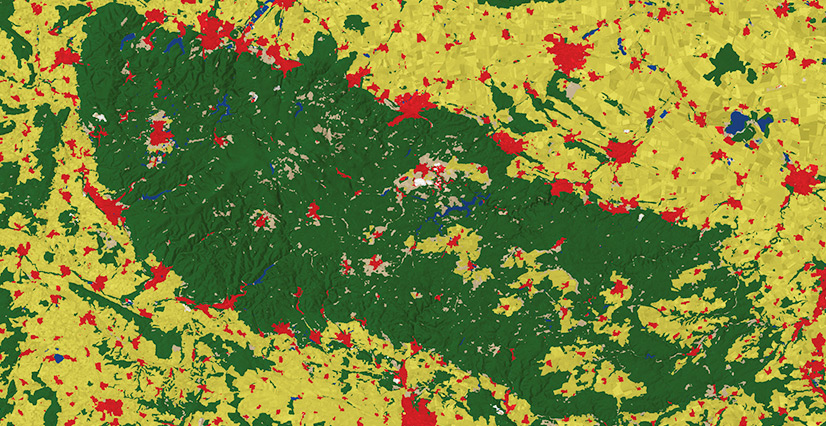
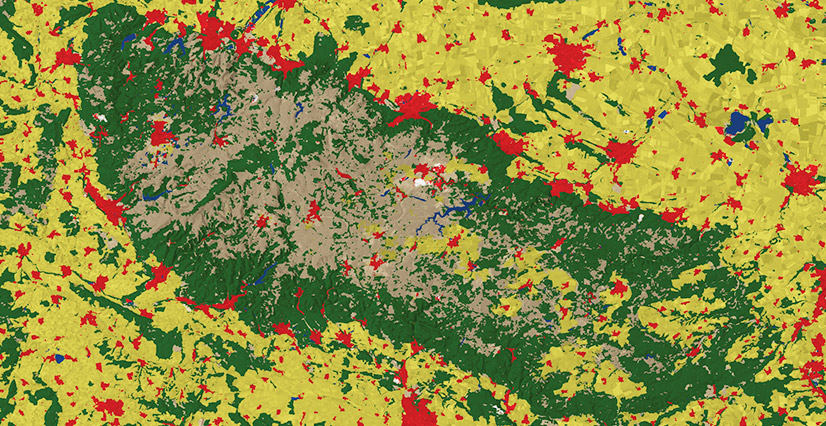
In Germany’s Harz mountains, a three-year bark beetle outbreak caused significant forest loss, which can be seen when comparing imagery from 2017 (first image) and 2023 (second image).
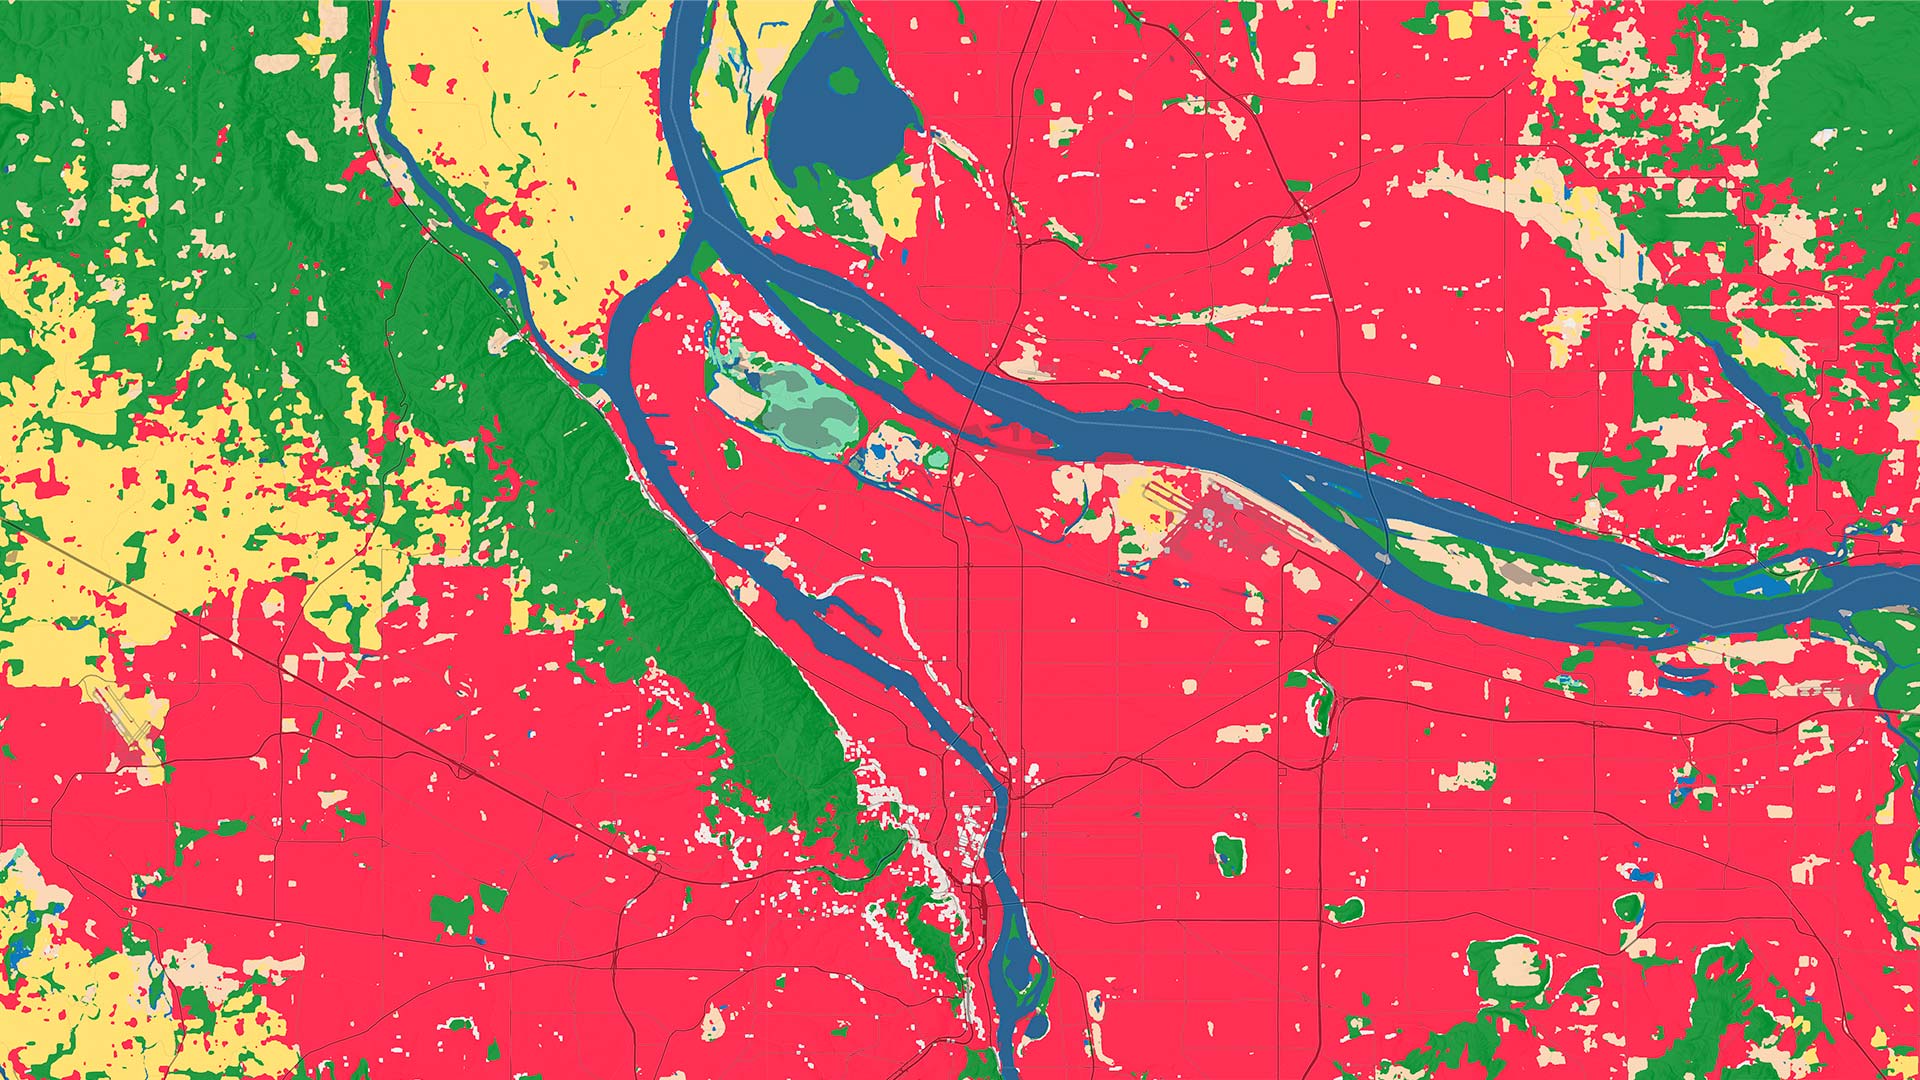
The maps identify nine surface classes including water, trees, crops, built areas, and bare ground. Government resource agencies use land cover as a basis for understanding trends in natural capital, which helps define planning priorities and budget allocations.
Ensuring Accessible Data
Making this information accessible is a key component of Esri’s mapping initiative.
“Availability doesn’t necessarily mean accessibility,” Waterman said. “Up until recently, this kind of data was only accessible to those with the hard skills and financial and computing resources required to process it.”
That’s why Esri decided to democratize access by developing the Land Cover Explorer app. It lets users visualize changes in land cover through Animate and Swipe modes, filter by class, and view statistical coverage charts.
More than 10 million GIS users have direct access via web services in ArcGIS Living Atlas. Esri also makes the data available for download through the Land Cover Explorer app. To ensure that everyone can use these maps and downloads, they are distributed using a Creative Commons by Attribution (CC BY 4.0) license.
Real-World Applications
Having annual data allows users to understand how things have changed and help predict how things might change into the future, Waterman explained. The time-series approach is particularly valuable for detecting environmental transformations that unfold gradually. The maps support monitoring of forest cover changes, agricultural cycles, and urban expansion patterns.
One application of the maps involves tracking forest loss in Germany, where bark beetle infestations have devastated spruce stands. Between 2018 and 2021, Germany lost about 5 percent of its forests, mainly due to beetles, drought, and storms. A land-cover time series helps visualize these changes.
Technology and Accuracy
Impact Observatory’s deep learning model processes more than 2 million Earth observations annually from Sentinel-2’s multispectral imagery. The approach scales computing resources in the cloud to generate global coverage in days rather than years.
Thanks to this unique methodology, an entire year of observations can be processed and mapped globally in a matter of days. But while the maps excel at regional and global-scale analysis, highly localized results can vary, according to Waterman.
“It’s important to keep in context what this map is,” he said. “Given the spectral and spatial resolution of the source data, coupled with the classification strategy and methodologies, its strengths are rooted in global and regional applications.”