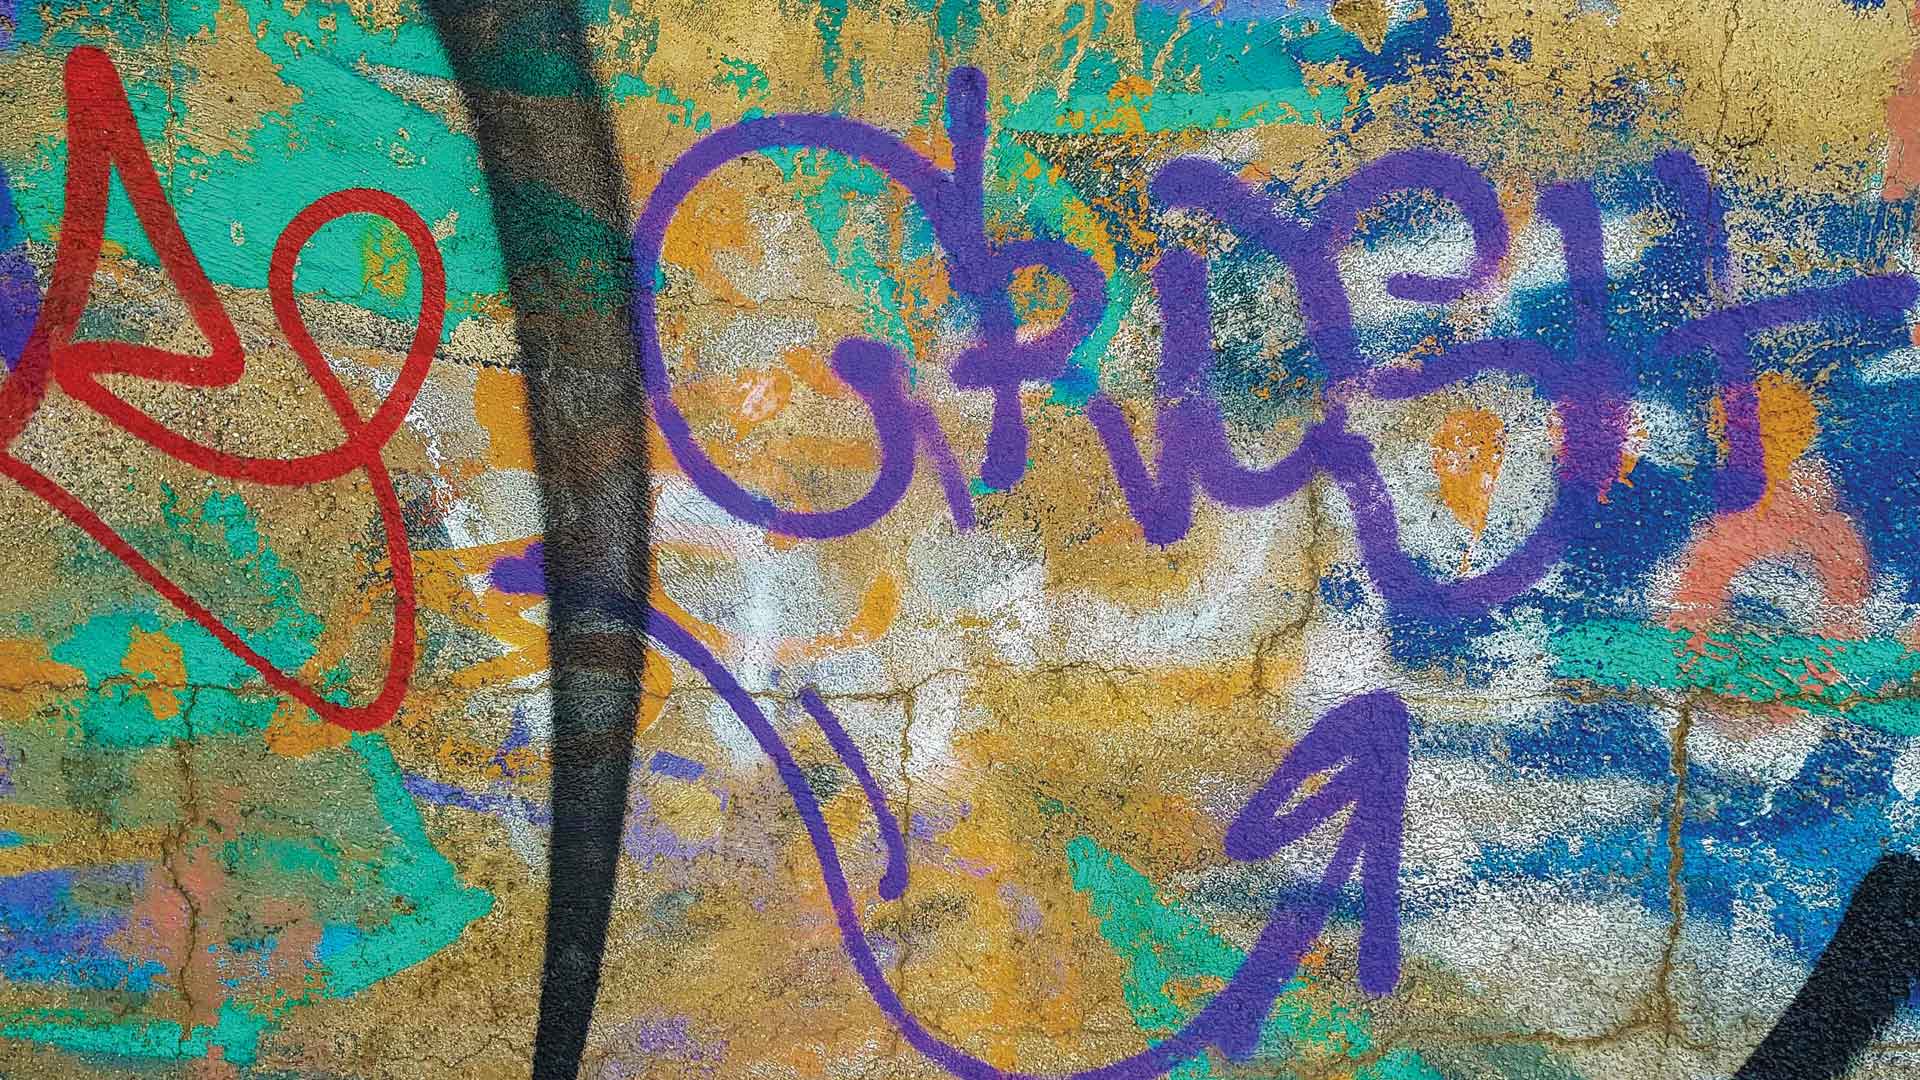
The cost of monitoring, detecting, removing, and repairing graffiti damage in the United States is estimated to be between $15 and $18 billion per year. And the problem is ubiquitous. Tagging is found on public and private property in small towns, large cities, urban centers, and rural areas alike.
Several years ago, the City of Tempe, Arizona, assembled a Graffiti Abatement Team to drive the city’s streets, looking for and removing graffiti. This helped city staff members identify graffiti hot spots so they could pay greater attention to those areas. In addition, a 311 call center was made available so members of the public could report incidents of graffiti, as well as other city-related issues.
“Graffiti affects city residents socially, environmentally, and financially,” said Seth Lewis, Tempe’s lead programmer analyst for enterprise GIS and data analytics. “Neighborhoods that are spray-painted by taggers can experience a reduced sense of community pride. We also see an adverse effect on housing prices in heavily tagged areas.”
In 2015, members of the Graffiti Abatement Team met with Lewis to determine how they could use GIS to help facilitate their work. Using ArcGIS Collector, ArcGIS Online, ArcGIS Enterprise, and an enterprise geodatabase, he provided them with an editable web map interface.
This was a significant enhancement to their work. But team members still had to drive the roads of Tempe looking for graffiti. They wanted more out of their GIS.
A Graffiti Abatement Service Platform
A breakthrough came in late 2019 when the City of Tempe announced its graffiti abatement service platform. The platform leverages machine learning, image recognition, event messaging, and ArcGIS technology to optimize the city’s graffiti abatement operations. It was developed with Arizona State University’s (ASU) Center for Smart Cities and Regions (CSCR) and the ASU Smart City Cloud Innovation Center (CIC), which is sponsored by Amazon.

Essentially, city vehicles are fitted with cameras that capture imagery of possible graffiti and stream that to the cloud. The imagery is then run against object recognition models, and if graffiti is detected, staff are notified of current incidents via event messaging.
“For this project, we made extensive use of [ArcGIS] GeoEvent Server and ArcGIS Online,” said Lewis.
He employed an Esri connector to integrate RabbitMQ, an open-source message-broker platform, with GeoEvent Server. The graffiti data is obtained via a program written in Python that runs on a high-performance Karbon 700 computer. The program captures images from the vehicle-mounted cameras, and the imagery is assessed using a machine learning object detection model.
“The model determines whether or not the image contains graffiti,” Lewis explained. “If an image is deemed to be graffiti with suitable confidence, then two events take place. First, the image is copied to an Amazon Web Services (AWS) Simple Storage Service (S3). This stores the data and its descriptive metadata. Next, a message is published to the RabbitMQ message queue. That message contains the URL of the graffiti photo in S3 and the GPS coordinates of where the image was captured. … GeoEvent Server is a consumer of RabbitMQ. Each time GeoEvent [Server] receives a new message from RabbitMQ, it transforms the message into a point feature and then publishes that event to a feature service in ArcGIS Online.”
Graffiti abatement staff, who are using Collector, see those features that have been identified by the model as probable graffiti in a separate layer on their displayed maps. They can then decide whether the area needs immediate attention or if they can wait until later in the workday to check it out.
“To date, city analysis shows that approximately 80–85 percent of abated graffiti is discovered and logged by staff on a proactive basis,” said Lewis, meaning that they go out and search for it.
But if staff members receive data in advance, they can use it to optimize their workflows and plan better inspection routes. For example, if a vehicle with a mounted camera begins driving at 2:30 a.m. while graffiti staff start their day at 5:30 a.m., those staff members benefit from three additional hours of autonomous data collection.
The city’s Graffiti Management Team also has access to a dashboard built with ArcGIS Dashboards that shows, by default, a given day’s graffiti abatement activity and is updated every five minutes. Managers can filter the data by date, date range, and location type to analyze graffiti incidents more closely.
A Model with Proven Performance
Staff and students at ASU’s CIC created the machine learning model used by the City of Tempe to detect graffiti. A team of managers and a solutions architect ran the project, and ASU computer science graduate students, who were completing internships at the CIC, were tasked with developing the model.
They began by using an existing object detection model from California Polytechnic State University, San Luis Obispo. The City of Tempe provided CIC and AWS staff with approximately 15,000 photos that had been captured as part of its abatement efforts. These images were then classified by hand and identified as graffiti.
As part of training and validating the model, students adjusted various parameters and let the model run for one to two hours each time. Students also trained the model using imagery from outside sources, such as search engines and photos captured by phones, that may or may not have been considered graffiti in their original context.
“The overarching performance management goals of the city when it comes to graffiti abatement are to reduce the number of graffiti incidents and proactively abate [and] track emerging hot spots,” said Lewis. “Tempe’s performance measure goal is to achieve one occurrence of graffiti, on average, per four miles, as measured in an annual audit conducted by city staff. The 2013 annual audit showed the average number of incidents was 15.17 per four miles, while in 2019 the average number had dropped to 1.3 [for the same area].”
GIS-based machine learning is not only making graffiti abatement in Tempe more efficient, but it is also contributing to increased success.