Beginning a project that calls your GIS skills into action can be exciting—and occasionally overwhelming. Often, when I’ve begun a project, I’ve jumped right into it and started gathering or cleaning data, bringing it into a GIS application, and resorting to my typical mapping and analysis methods. Sometimes this is fine, but as a project progresses, there may be limited time to readjust and tweak the project to better fit expectations.
Thankfully, there are some simple topics that you can consider to provide clarity and reduce the likelihood of delays or even having to start over.
Understanding What Questions You’re Trying to Answer
When beginning a project, it can be tempting to jump in and begin gathering and analyzing the data and creating map products. But take a few minutes to consider several questions:
- Why are you making this product?
- What do you want to get out of this product?
- What should the end user get out of this product?
- What are the primary content requirements? Do they lend themselves to a simple static map; a StoryMaps story; a multipage re-port describing analysis, methods, and data; or something else?
- What are the functional requirements?
- What are the data sources? Will you need to search for the required data, and if so, is it relatively easy to obtain? Will the client provide the data, and if they do, is it formatted with the necessary fields?
- What are the technology and tools stack (such as tools, languages, plug-ins, or web tools) used in the project? Note the tools or software needed to prepare the data and make sure you understand your work sequence.
What the Final Product Will Look Like
There have been many times when I’ve begun a project only to learn that an interactive web map is required in addition to a static map, or that a small-scale map needs to show more detail and therefore multiple larger-scale maps are required.
Depending on your data and audience, be mindful of potential sensitive information such as names, addresses, and specific data of a personal nature, especially if the finished product will be a publicly available web map. For example, I had a case where I was asked to share an “internal-only” web map with outside entities. Because of some sensitive information, I had to duplicate the dataset and remove any personally identifiable information and create a separate web map for public access.
You should also consider what the final deliverable will be. A static map in the form of a PDF or as an image in a report or PowerPoint deck will require significantly different time investments. Also think about what—if any—user interaction you will enable, such as pop-up boxes, panning, and a selectable legend.
If your project involves a StoryMaps story, make sure you know if it can be shared publicly or only with certain persons or groups. Consider whether sensitive or personably identifiable information will be shown. Finally, do you have a link that you can share and others can access?
Geoprocessing Tools to Use
Often your project will use at least one geoprocessing tool. Common ones that I have used include geocoding tools to create drive-time areas and buffers and spatial joins. Thinking back to your initial map questions, consider what your project needs to show or produce and what tools you will need. If you’re unfamiliar with a tool, there are multiple resources for help. Search the ArcGIS Pro website’s Help section, consult esri.com for help documents, or consider posting a question to the Esri Support forum or Esri Community. If you have web-based tools that are your go-to’s, make sure you know your username and password and possibly your API key, depending on the tool.
Field Names and Settings
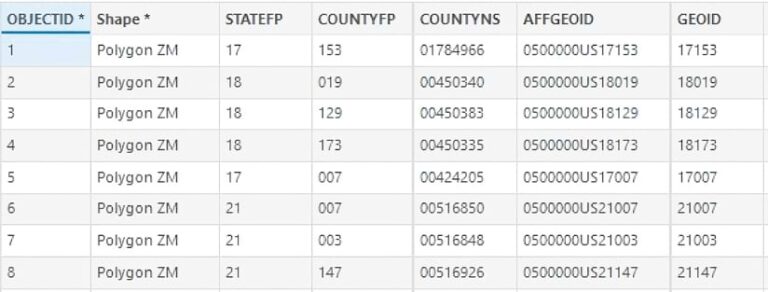
Often in my quick-moving workflow, I forget a parameter or field name for a spatial join. For example, when working with US census-related data, there can be fields that are candidates to join to census data, but it’s easy to lose track of what those fields are. Pay attention to the geographic unit of analysis (such as state, county, or census tract) that you are working with. In addition, one field might be a text type while another might be numeric. Do yourself a favor and make a note to help you remember the field names and the data types that you’re working with.
Symbology: Color Ramps, Symbol Size/Shape/Color
Will you use an existing color ramp or other map symbology, either chosen from personal preference or specified by your client or employer? If the answer is no, you might consider creating your symbology by using new icons or colors. Lately, I’ve been creating maps that show multiple layers and symbology, so I need to be sure not to visually overwhelm important elements.

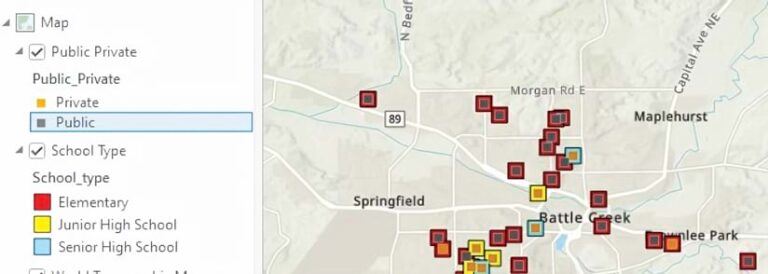
It’s also helpful to jot down symbology size if you’re going to overlap. For example, if I want to visualize school levels by elementary, junior, and senior high as well as by public or private schools, I might show school level as a colored square and overlay a layer and symbolize the public/private attribute as a square or other symbol.

Communication
When it comes to working in the GIS industry, clear communication is often as necessary as knowing ArcPy, ModelBuilder, or R scripts. Whether you need to update colleagues, clients, or your organization, clear and frequent communication is important to helping a project progress smoothly with few misunderstandings.
Remember to update colleagues on workflow or specification parameters such as color ramp, color values, or the ramp style.
Also, be able to explain how you obtained data or created and calculated new fields. This is important to document somewhere, preferably in the metadata. For example, if you’re calculating some phenomena per geographic unit, such as the number of people, homeowners, or single-parent households per square mile, remember the field names and what calculation you performed. If you’ve joined external data and are using it to calculate a new field, be sure you remember your source and the data obtained.
Finally, document your data sources (including a URL and the date obtained). Make this part of your mapping notes for future reference.
Archiving Data and Project Notes and Documents
I remember very well one of the first and best pieces of advice from my graduate school mentor—”Know thy data.” I have tried to make this a habit in my GIS projects because inevitably I’ll need to return to the source to verify a field or metadata. The handful of times that I’ve failed to do this and got burned reinforced my motivation to resume my habit. As you work with and save or archive your project data, think about where the original and working dataset is archived, what element of the project it’s related to, and what the original data source is.
Project Closing/Debriefing
You might think that once the due date has been met, the presentation has concluded, and your boss has offered congratulations, you’re done with the project. Not quite! It can be valuable to close out the project by meeting with everyone who had a hand in the project to broadly review what went right and what could be changed or improved. This can be a valuable time to meet and process others’ opinions and feedback. Remember to document what went right so that it can be repeated and note what could be improved the next time around. And confirm that all files from the project are compiled, appropriately stored, and kept easily accessible.
URISA Resources
Finally, don’t forget the great resources that URISA provides, including mentoring; education; and various workshops, webinars, and conferences. If you haven’t logged in to your URISA account lately, you’re missing out on some great resources. Some of us may be in supervisory positions, and implementing these questions and processes can help others better focus their time and effort on delivering an excellent product. Be sure to check out the URISA Members Dashboard for recent posts or to post your own question about a GIS tool, process, or conundrum. There are more than 2,400 URISA members from all over the United States and around the world who have a wealth of knowledge and experience. Visit urisa.org for links to various educational programs and resources.

