Fire Department Applies Tracker for ArcGIS
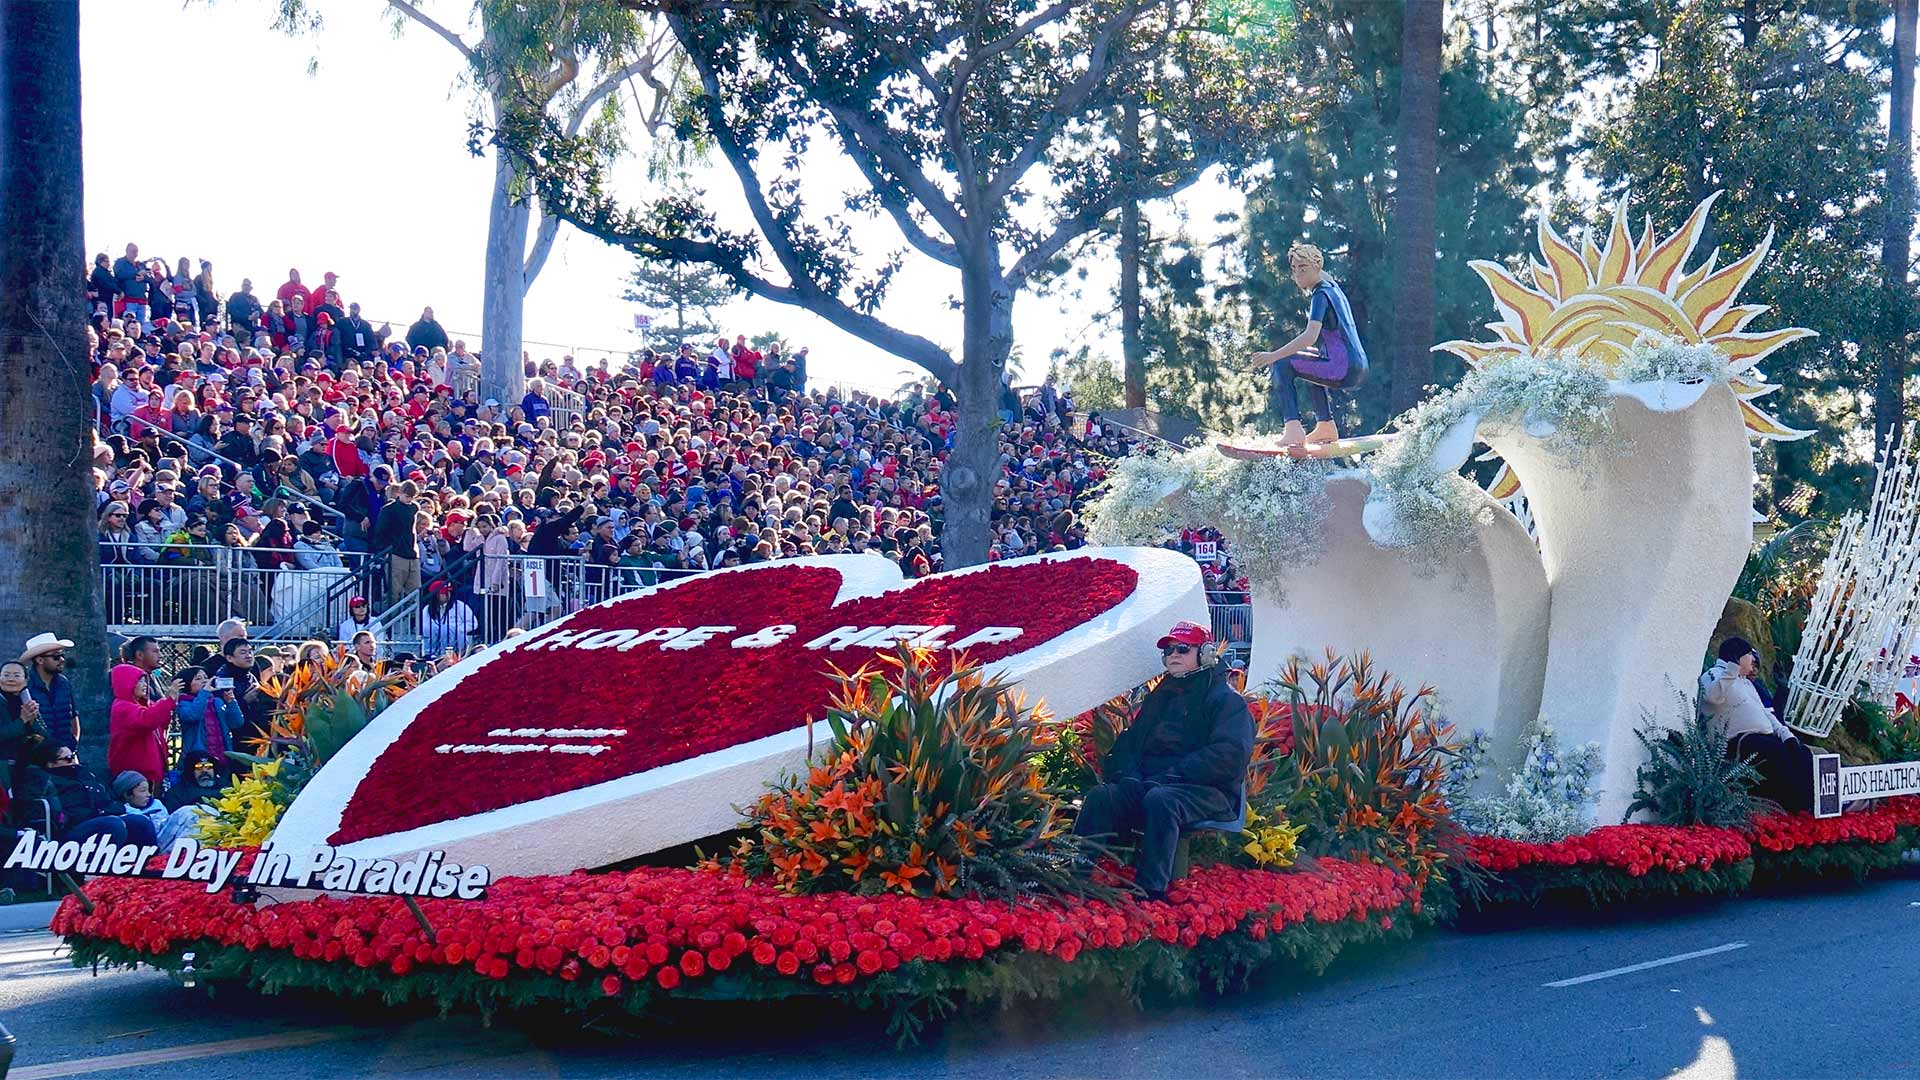
One of the United States’ oldest parades is the Tournament of Roses Parade, which started in 1890 in Pasadena, California, and is now held every New Year’s Day to showcase the abundance of flowers and greenery that adorn Southern California all winter. The floats in the parade must be completely covered with flowers or other natural materials, making this a unique and eye-catching event.
In 1902, the festivities expanded to include the Rose Bowl, now a very popular collegiate football game that happens later in the day. From the 3,000 spectators who came out for the very first Rose Parade, attendance and interest in the combined events has grown enormously. In 2019, the parade and game attracted more than 800,000 live attendees and 59.3 million television viewers around the world.
The safety of participants and attendees is a critical concern for the city, especially given the high visibility of these events. These responsibilities—which include managing public safety for the Rose Parade, the Rose Bowl, and any associated events before and after New Year’s Day—are entrusted to the Pasadena Fire Department and the Pasadena Police Department.

The fire department, which has provided support for the Rose Parade since its inception, is composed of eight fire stations and has a staff of 181 people. Usually, the department serves a population of 142,250 people and, on average, receives 55 calls for service each day.
As Pasadena’s New Year’s Day festivities have expanded to include eight significant events from December 28 to January 2, so have the demands on the fire department. In addition to experiencing a 100 percent increase in call volume over those six days, the fire department now has to collaborate with 19 different federal, state, and local agencies in the Multi-Agency Coordination Center (MACC).
To effectively manage the spike in workload that goes along with the influx of hundreds of thousands of people into suburban Pasadena, the fire department depends on a comprehensive situational awareness and response plan. This now includes heavy reliance on ArcGIS Pro, Drone2Map for ArcGIS, Collector for ArcGIS, ArcGIS Online, Operations Dashboard for ArcGIS, and the new Tracker for ArcGIS.
Siloed Data and Temporary Assets Present a Challenge
Unifying the various agencies within the MACC can be complicated. Each agency brings its own protocols, technology, and data, which makes it difficult to provide a common operating picture that serves as the authoritative reference for managing logistics and ensuring public safety. But authoritative data sources and systems are key to ensuring that public safety personnel have a good understanding of the area so they can efficiently and effectively coordinate their response to any incidents.
The five-and-a-half-mile parade route is more complex than it appears on television. The parade itself has a Level 1 Special Event Assessment Rating from the federal government, meaning it is of significant national importance. To help ensure the public’s safety, the Tournament of Roses erects temporary fencing and vehicle barricades, which impact the normal flow of traffic. Even agency representatives who are familiar with the area find it challenging to negotiate various closures. Additionally, public safety personnel have to monitor the grandstands and broadcast booths that spectators and the media use, but these are also temporary structures, so capturing their precise locations is difficult as well.
With Better Technology Comes Better Maps
Prior to 2019, the incident action plan (IAP) for the Rose Parade, the Rose Bowl, and their associated events relied on paper maps. The printed IAP was distributed to each agency and circulated among units on a need-to-know basis.
When a call was received, dispatchers at the area’s Verdugo Fire Communications Center had to thumb through the IAP’s printed maps to find out which unit was responsible for responding to incidents in the caller’s zone. The assigned unit then had to locate the incident on its own IAP map to quickly identify any potential delays due to changes in traffic flow.
For Pasadena Fire Department captain Oscar Sepulveda III, building a comprehensive digital map that pulled data from one authoritative source and made it available to all agencies was an important goal.
“The vast majority of data derived from the fire service is siloed, thereby inhibiting efficient collaboration with other public safety entities,” said Sepulveda. “Ensuring that all levels of command are empowered with real-time data increases public safety and overall situational awareness for firefighters.”
Sepulveda has been an ArcGIS user since 2015, so he was confident that he could use the geoprocessing tools in ArcGIS Pro to begin creating a common operating picture for all public safety personnel working the New Year’s events.
His first task was to digitize the AutoCAD-rendered maps that the largely volunteer-staffed Tournament of Roses organization had. From these maps, Sepulveda was able to use ArcGIS Pro to produce new layers of information, adding a tremendous amount of detail that had previously not been available—from real-time asset location and incident data that could be consumed in the field to street impact information that could be leveraged against the Waze navigation app.

Next, Sepulveda used Drone2Map to create drone-captured imagery of the parade-ready environment, which he used as web map overlays. These overlays provided details of the as-built parade environment to the point that a user would be able to zoom in on something as finite as an individual grandstand seat.
Using Collector, Sepulveda and his team then gathered accurate location data for important assets, such as the grandstands, the staging areas for parade participants and emergency response vehicles, and the zones to which emergency response personnel were assigned. This data, presented as points, lines, and polygons, was fed into ArcGIS Online as feature layers.
With all this new data, Sepulveda and his team created a comprehensive digital map of the parade route, the Rose Bowl, and all the surrounding areas. For the 2019 events, this map would be used to support the needs of the unified area command and enhance security on New Year’s Day.
Location, Location, Location—In Real Time
For any incident, being able to identify and mobilize the nearest unit is critical. To that end, Sepulveda wanted to have real-time data of all emergency response assets and ensure that this was visible at the MACC, where situational awareness for Pasadena’s New Year’s events is managed. The objective was to align the distribution of response units with historical data on previous incident locations, meaning that the concentration of an effective response force would most likely be positioned in an area where it could stop an emergency from escalating.
While preparing for these events, Sepulveda learned from his Esri account manager about the new Tracker app, which lets supervisors and managers track field personnel by capturing their location tracks on a mobile app. Staff at the MACC could then view the captured tracks in a web app or as a feature service in other ArcGIS solutions. With approval from his technology-forward fire chief Bertral Washington, Sepulveda informed the Tournament of Roses’ liaison and planning committee about this new capability and obtained the organization’s support to use Tracker during the 2019 event to test the technology.
On January 1, 2019, the Rose Parade, Rose Bowl, and postparade events were supported by fire engines; truck companies; ambulances; emergency medical services teams on bikes, in carts and utility vehicles, and on foot; American Red Cross first aid stations; Urban Search and Rescue California Task Force 4; water tenders; a brush patrol firefighting unit; and additional sworn personnel. The rescue carts and bike teams carried iPads equipped with Tracker, which was downloaded for the proof-of-concept project. In addition, multiple parade participants, including band leaders and float drivers, downloaded the Tracker app to their smartphones.
For the duration of the parade, each unit and participant ran Tracker, enabling their location tracks to be collected and fed directly into ArcGIS, where area commanders in the MACC could view them in real time in Operations Dashboard. This enabled dispatchers to identify not only the unit closest to an incident but also which unit would have the fastest response time based on traffic jams, barricades, and other traffic flow changes. What’s more, each unit was able to use the digital event map in a dashboard or a web app to zoom in on any area of interest, which could help them quickly navigate impacted and restricted routes to reach an incident in the most efficient way. Additionally, for the first time, fire commanders were able to monitor assets in real time, via a single source, which allowed them to improve resource management during the live events.
The Value of Coordinating Resources
Having access to a single, authoritative digital map of all New Year’s Day events in Pasadena enabled the agencies in the MACC to better coordinate their resources. Each agency could easily turn off any data layers that weren’t relevant to their work. That eliminated the inefficiencies of having to leaf through the various static maps that used to constitute the IAP.
Furthermore, having the real-time location tracks of field personnel allowed area commanders to continually assess the balance of first responder coverage with areas of activity. By using the map with real-time location data for each available response unit, the dispatchers from the Verdugo Fire Communications Center were able to effectively dispatch the unit closest to each incident. Although there was only one high-visibility incident—a parade float that caught fire but was quickly extinguished—there was no question that the emergency response plan for 2019 was more efficient and effective compared to previous years.
“How do you measure the value of being able to potentially save one life, not to mention the potential to save multiple lives? It’s a very real possibility in an event like this,” said Sepulveda. “That’s the value of Tracker for ArcGIS.”
After all the New Year’s celebration events, the Pasadena Fire Department conducted a postincident analysis. It concluded that use of the ArcGIS platform contributed to the success of this year’s events and is an effective way to provide real-time situational awareness. Modern technology enhanced the strategic and tactical objectives associated with this year’s Rose Parade, the Rose Bowl, and all pre- and postevent activities, and it will be used going forward into 2020 and thereafter.