St. Petersburg, Florida, Modernizes and Improves Policing Methods with ArcGIS Technology
For years, the police department in St. Petersburg, Florida, relied on paper and spreadsheets to fight crime.
“Everything was text based,” said Frank Ullven, a systems analyst on the St. Petersburg Police Department’s Information and Technology Services (ITS) team. “We didn’t have any maps. It was all street names and addresses.”
Ullven remembers how police officers in the Gulf Coast community had to read addresses in columns to figure out where incidents were occurring. Matching a crime to an address was difficult without visual representation, especially when new streets were added to the community or street names got changed.

“Officers don’t have to memorize all that, like this used to be 2nd Street South, but now it’s University Way South,” said Ullven.
The police department’s ITS team, which includes a GIS specialist, a systems analyst, and a data specialist, along with a team of five analysts in the Intelligence-Led Policing (ILP) unit, set out to fix this. Together, the group administers the ArcGIS platform and creates the maps and dashboards used by more than 575 officers, detectives, and supervisors at the St. Petersburg Police Department. More specifically, the ITS unit manages the police department’s ArcGIS Enterprise portal, while the ILP unit is a data-driven center that provides support to tactical, strategic, and operational initiatives.
According to Dr. Richard Ferner, Jr., the ILP unit supervisor, several department stakeholders, including the chief of police and command staff, were overwhelmed by the sheer volume of text-based information available about crime. The police department did implement older types of geospatial technology, but they lacked the flexibility needed to support custom, user-friendly visualizations.
“Those solutions did not promote robust and relevant visualizations,” said Ferner. “Users had little incentive to utilize those tools when deliberating on a course of action, such as proactive patrol assignments or developing leads in identifying suspects.” This made it difficult for staff and supervisors to gain the meaningful insight they need to make decisions and do their jobs effectively.
Five years ago, the arrival of a new police chief, Anthony Holloway, marked the St. Petersburg Police Department’s transition to a data-driven organization. Holloway advocated adopting a management model called CompStat, or computer statistics, a policing method that uses timely and accurate information to combat crime efficiently and improve police accountability.
At the time, the ITS team realized it needed to move away from a static environment and deliver content in an interactive manner.
“The minute I heard Esri developed an enterprise solution that could allow the user community to interact with the content we publish, I knew, unequivocally, that was the solution we needed,” said Ferner.
In 2016, the department implemented ArcGIS Enterprise 10.5 and ArcGIS Pro and has kept pace with each upgrade, steadily adding products such as ArcGIS Insights and ArcGIS Dashboards.
Canvassing a neighborhood no longer requires a six-foot-long paper map and tons of hard-to-decipher markings.
ArcGIS Enterprise was key in supporting the department’s need for a secure, behind-the-firewall enterprise platform that powered data management and analysis, especially in the context of law enforcement data.
“There’s a level of comfort in knowing that it’s our data on our in-house system and that it’s not located somewhere that we don’t have control over who sees it or what’s being accessed,” said Ullven.
Before implementing ArcGIS Enterprise, analysts at the St. Petersburg Police Department created static content that was distributed through email and posted to a file sharing system and Microsoft SharePoint. Disparate tables, charts, and graphs did not tell the whole story, and there was no way to customize dashboards to visualize data and come up with a common operating picture.
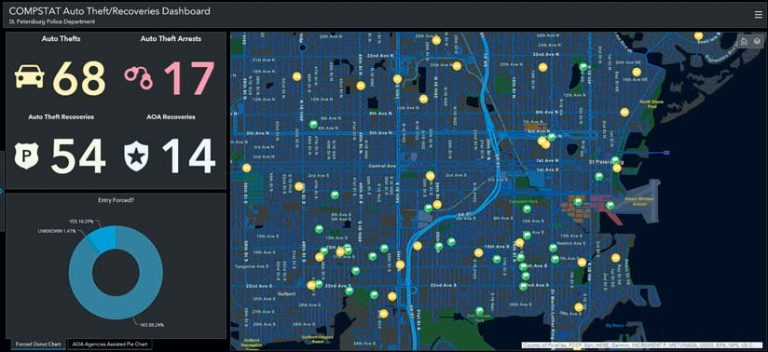
Since moving to the ArcGIS platform, however, analysts have been able to create dashboards and story maps that focus specifically on what each unit needs to know. That way, people don’t get overwhelmed with irrelevant information.
“Now that we’ve evolved onto the Esri platform, we can carve out highly nuanced, relevant data that matters and answers questions,” said Ferner. “It helps the staff and supervisors carve out a strategy and set of tactics for immediate application.”
These days, data is refreshed 45 minutes before each shift, which allows watch commanders to detect emerging crime trends and evaluate initiatives on the go. Analysts use the Crime Analysis configuration in ArcGIS Pro along with ArcGIS Insights to analyze data and then share interactive content via story maps and dashboards made with ArcGIS Enterprise.
“Canvassing a neighborhood no longer requires a six-foot-long paper map and tons of hard-to-decipher markings,” said Kevin Christy, the ITS team’s GIS specialist.
Instead, an app created using Web AppBuilder for ArcGIS made the process more targeted and efficient by allowing detectives to live track the addresses they visit. And Survey123 for ArcGIS enhanced the department’s Eagle Eye program, a public camera registration website, by making it easier to geocode addresses and maintain an up-to-date camera locator app.
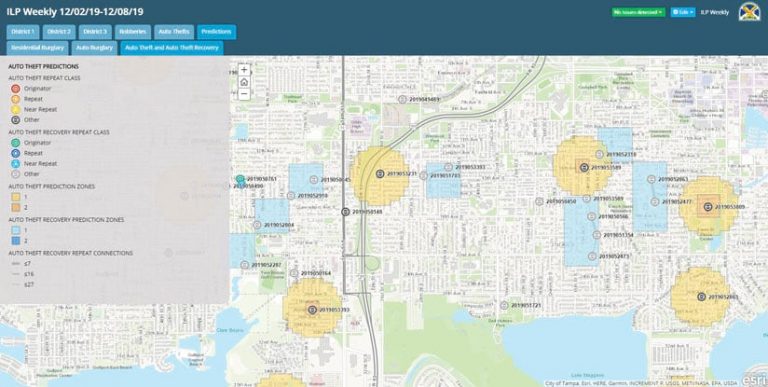
In one example, the command team was looking for information about parking meters being destroyed in downtown St. Petersburg. Analysts pulled crime data for areas around parking meters, used ArcGIS Pro to predict a crime risk area, and published this data on a map within ArcGIS Enterprise. Staff were then able to use the prediction to plan operations.

The data to make the prediction was acquired from the records management system, where detailed accounts of crime around each parking meter location were documented. Analysts then geocoded each parking meter location in ArcGIS Pro and subsequently published the content as a hosted feature layer in ArcGIS Enterprise.
Armed with this analysis, police officers patrolled the risk area identified in the prediction and encountered the suspects, who were arrested as they prepared to commit more crimes. Prior to implementing this vast array of ArcGIS technology, doing this kind of analysis and making such a prediction were not possible.
Now, more officers are requesting specific dashboards from the ILP and ITS units. They want to see what ArcGIS technology can do, and when they get a tour of it, their eyes light up, according to Christy.
“I see their wheels turning,” he said. “The big thing is tailoring it for exactly what the end user wants. Whether it’s ‘I want these metrics in my dashboards’ or ‘I want these colors’ or ‘I want an app that does x, y, z,’ it’s all about giving them what they want. If they don’t get exactly what they want, they’re less likely to use it.”
Ferner also noted that having a growing number of younger police officers has contributed to a critical mass of users in the department.
“One of our biggest challenges was the cultural dynamic in giving them access to these products and assigning accountability to the metrics,” he said. “The workforce here is also becoming younger, and we’ve discovered that they are more adept with using different technologies. Even if we had a product 10 years ago that is as sophisticated as this one is today, I don’t think the staff then would have been so accepting of these technologies.”
The move from static maps and data that officers couldn’t fully engage with to a more interactive mapping platform has transformed the department.
“Esri allows officers to have a customized product that really presents them with geospatial data that prompts questions,” said Christy. “They can look at the data, they can ask questions, and now they are getting more insights than they had in the past. It’s really helping to drive better policing.”

