Esri’s ArcGIS Online team is constantly striving to make this collaborative, cloud-based platform more powerful and easier to use.
Find out more about some of the most significant capabilities and resources released over the past few months, including easier ways to find content, creative learning and teaching aids, a new Relationship mapping style, and updated tools for administering organizational accounts.
Authoritative Content

ArcGIS Online contains a rich collection of publicly available geospatial content thanks in large part to the millions of items published and shared by users. Many of these users—from state and local governments to the US Forest Service and the National Oceanic and Atmospheric Administration (NOAA)—provide the most authoritative content for their communities.
To make this kind of authoritative content easier to find, publishers and administrators of verified organizational accounts can add an authoritative badge to the content they upload to ArcGIS Online. Then, when users go looking for publicly shared content, they can select the Authoritative filter to pare down their search results so they only show content that is marked as authoritative.
Resources for Learning and Teaching GIS
Esri has released a slew of new resources for learning and teaching ArcGIS Online.
For anyone who wants to experience what is possible with ArcGIS Online, Esri creates learn paths, curated collections of hands-on resources that help users get more familiar with particular ArcGIS solutions and workflows. There are learn paths for people new to ArcGIS Online, as well as for users who are looking to hone skills like visualization and data analysis.

The Mapping and Visualization learn path, for instance, teaches users how to create maps and make their data visually stunning. The first lesson in this path, which is all about getting started with ArcGIS Online, takes participants step by step through how to produce and share an evacuation map in preparation for an incoming hurricane. In the next lesson, users access ArcGIS Living Atlas of the World to build an earthquake map. The third lesson teaches users how to find predominant patterns in their data by applying smart mapping techniques.
For those who teach with GIS, Esri also has a new implementation guide for teachers, schools, and districts called Teach with GIS. It contains step-by-step information to help bring mapping and analysis into all classrooms. And the curriculum builder provides a bank of lessons for an assortment of student experience levels and subjects, from mapping population change to teaching world time zones in 3D. The capabilities covered in Teach with GIS include data collection and management, mapping and visualization, sharing and collaborating, real-time GIS, 3D, imagery and remote sensing, and spatial analytics.
Multivariate Mapping: A New Way to Visualize Relationships
The new Relationship mapping style lets ArcGIS Online users more easily explore possible relationships between two attributes. By employing a mapping technique called bivariate choropleth mapping, this style combines two color ramps into a grid-like legend that shows all pattern combinations across a map.

Say a user has two data patterns, one for diabetes and one for obesity, and she wants to find out if they converge geographically. Looking at the maps individually, she can see that the patterns are similar. But using the Relationship mapping style lets her clearly locate where diabetes and obesity are both high, both low, or occur strongly on their own.
Or how about another user who’s wondering if there is a relationship between atmospheric pressure and wind speed during the life-span of a hurricane? The two color ramps—again, one ramp for each attribute—create a spectrum of colors that show where the patterns are high and low both independently and together. The user can now easily see that hurricanes are strongest when they have low pressure and high wind speed.
Of course, it has always been possible to use this mapping technique in ArcGIS Online. However, it used to require more time and customization, and it wasn’t really something a beginner could do. Now, the new Relationship mapping style simplifies the process of being able to see these types of connections. All users need to do is select the two topics they want to compare and then choose this mapping style.
Administering ArcGIS Online Organizational Accounts
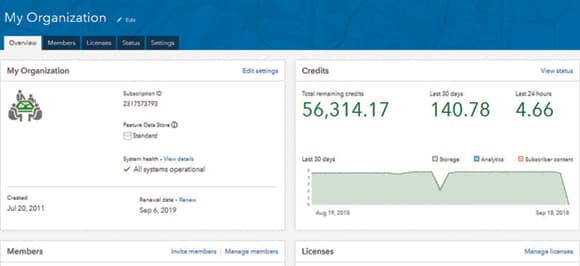
The My Organization page has been redesigned, making it easier for administrators to manage members, access account information, and generally oversee an ArcGIS Online organizational account.
With the new Overview tab, which appears immediately upon logging in, administrators have quick access to key information—displayed on cards—including a look at system health, a summary of credits and membership, and which licenses the organization is using. The updated Members tab includes additional search and filter functionality so administrators can search by name or user name and filter based on user level or role. This tab also lets administrators look over the details about each user’s credit allocation, who’s assigned which licenses, and which groups members are part of.