In the last year and a half, Dayton, Ohio, has endured an unprecedented amount of tragedy and destruction. But as the city begins to emerge from these tough times, it will employ some recently developed, GIS-based technological enhancements that will result in smoother responses in the future.
A Difficult Year
In February 2019, a large water main break depressurized the city’s entire system, causing approximately 400,000 customers to be without water. And that was just a precursor of what was to come.
Just three months later, over Memorial Day weekend, a white supremacist group descended on downtown Dayton. While the rally was planned (and permitted because of free speech laws in the United States), a lot of preparation and resources went into making sure no violence took place. Senior leadership at the City of Dayton, along with staff from the police and fire departments, were able to watch the event live using cameras, which was valuable for everyone involved.
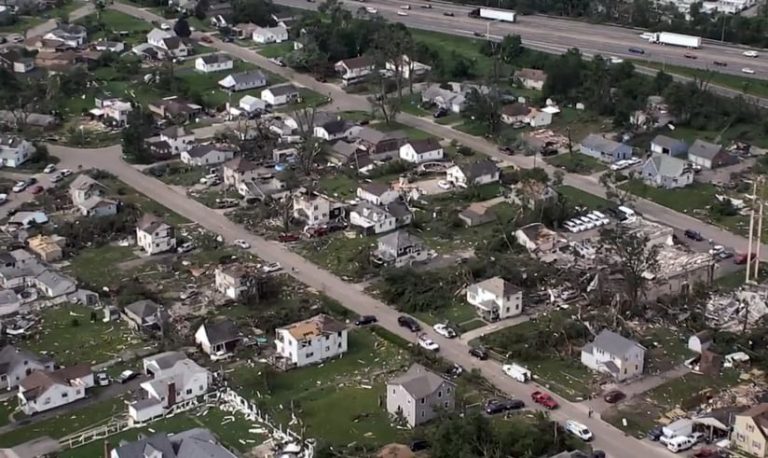
Before the emergency operations center for the rally was even taken down, 13 tornadoes ravaged the surrounding Miami Valley region. There was significant damage, and both Dayton water treatment plants lost power, causing 400,000 households to lose water again.

In August, a gunman walked down a city street, where hundreds of people were socializing in and around bars and restaurants, and started to shoot. In the aftermath, 9 people died, and 23 others were wounded. The actions of seven police officers saved countless lives.
Also in 2019, a Dayton police officer was mortally wounded while serving a search warrant, and a young Dayton firefighter died.
To say that 2019 was one of the toughest years in Dayton history is certainly an understatement. Everyone thought that 2020 would be a much better year. How could it not? The city of Dayton and its residents had gone through death and destruction but had risen to each challenge with the grit and tenacity that Dayton is known for.
A New Way to Plan for Emergencies
Late in 2019, after the dust from these crises had settled, the Department of Water’s GIS Division began planning to build a solution to assist all city departments when the emergency operations center opened or the city was planning a large-scale event.
With help from Captain Merritt Colton, an emergency planner with the Dayton Fire Department, and Sergeant Stephen Clark, the homeland security and emergency operations supervisor at the Dayton Police Department, the plan originally involved building web apps and dashboards—all within a story map structure.
During the planning process, the GIS Division reached out to Esri and spoke with Mike Cox, the director of Esri’s fire and emergency services solutions, and Kelly Auman, an account manager with Esri’s public safety team. Cox and Auman demonstrated some great solutions from around the country, which helped shape the final product.
Once the planning phase was complete and all involved parties were satisfied, the difficult process of building the solution got under way.
A Five-Part Solution
The first phase of development was to create the web app with editing capabilities that would be used for planning large-scale events. This app is useful for employees of the fire, police, public works, and water departments who may not have the expertise of a GIS professional but are able to put a point or polygon on a map and enter some basic data.
The next piece of the solution was to create a briefing story map. This is useful for large events, wherein personnel are staged at specific locations and certain areas are closed off. The GIS team put three, time-enabled web apps inside the story map that show the locations of road closures, areas and physical assets, and personnel. Emergency operations staff and leaders from the police and fire departments can play through each of the three web apps individually, or there is a static web app that shows all these details and is not time enabled.
The third part of the solution is for event management. This was the most challenging piece of the solution to develop because of the different components that went into it. The GIS Division used ArcGIS Workforce, ArcGIS Dashboards, and GeoAdaptor (formerly known as GeoMax) from Esri partner Geographic Technologies Group to build it.

Near the end of the planning stage, right before training was set to begin, Colton said he wanted a way to track fire equipment and personnel while events are in progress. Every fire vehicle already has an iPad in it, so at the beginning of each shift, personnel assigned to that piece of equipment can now log in to Workforce to allow their locations to be tracked. Using GeoAdaptor, which makes nonspatial data spatial, a query runs at a specified interval and uses x,y coordinates or addresses to place points on a map.
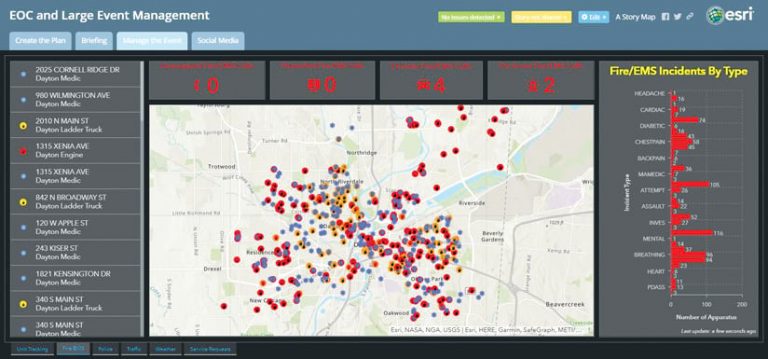
The GIS Division also created dashboards to show police and fire incidents and public works and water service requests. In addition, there is a dashboard that displays the current weather. Taken together, all this allows those in the emergency operations center to see the overall picture, no matter what type of event the city is experiencing.
The last part of the solution is a social media map that shows Twitter, Instagram, Flickr, webcam, and YouTube feeds. This would have been very useful during each of the emergency events that took place in 2019. For the tornadoes, this part of the solution would have given multiple departments a better understanding of where the initial damage was. During the mass shooting, police could have viewed social media to understand where additional victims may have been located.
A Hitch in the Rollout
Once the solution was finished, the GIS Division showed it to Colton and Clark, who began planning to use it for the First Four, a large college basketball event played as part of March Madness. Before the plan could be completed, however, the coronavirus disease 2019 (COVID-19) pandemic hit the United States.
While the pandemic has dealt a terrible blow to the nation and the world, some helpful things have come from it. It has prompted the City of Dayton to identify a few issues with its new Emergency Operations Center and Large Event solution that hadn’t been seen before, such as ways to give it a better structure and access to new data sources. In addition, the pandemic led the city to create a data team, which now has a head start in being able to stand up new dashboards.
Since the early stages of the COVID-19 pandemic, the data team has been responsible for giving city and department leaders insight into what is happening. City leadership wanted to see data from every department. Early on, the deputy city manager requested data on fire and police calls for the previous seven-day period, incoming fire and police calls in near real time, and public works and water service requests for the previous two weeks.
Because the city had done all the work to develop the Emergency Operations Center and Large Event solution, this project was easier to take on. The only extra piece that had to be incorporated into the solution was to put the dashboards into ArcGIS Hub Coronavirus Response Template. This allowed the GIS Division to more quickly turn data around that would be useful to city and department leadership.


