More than two billion people lack access to safe drinking water, three billion are without basic handwashing facilities, and more than four billion people do not have safely managed sanitation, according to the United Nations (UN). In 2015, the UN ratified the 17 Sustainable Development Goals (SDGs) to be achieved by 2030. Among them is SDG 6, the water, sanitation, and hygiene (WASH) goal, which seeks to ensure the availability and sustainable management of water and sanitation.

World Vision is a Christian organization that works in 106 countries with people experiencing poverty and other hardships to promote human transformation and social justice. In Kenya, the nongovernmental organization (NGO) recently conducted a study to help people gain access to clean water, sanitation, and good hygiene. It involved using ArcGIS technology to map community access to WASH assets and track progress in providing more of these critical resources to community members.
“The WASH program is fully implemented in Mogoi, Moigutwo, and Chesim—the three villages in the Bartabwa settlement of Baringo County targeted for our study,” said Everlyne Atandi, GIS specialist for World Vision Kenya. “We are using ArcGIS for planning and monitoring micro-level interventions to improve access to WASH services.”
To identify households within the villages that needed better access to WASH resources, World Vision Kenya took a census. The team used ArcGIS Survey123 for mobile data collection and included GPS coordinates to pinpoint specific households and related WASH facilities. Recorded asset information included water points, such as boreholes, standpipes, and protected springs; water supply systems, including water kiosks and water pipelines; latrines; handwashing stations; and waste disposal pits.
The team then analyzed the data to get a baseline status of how many households had access—and needed better access—to WASH services. World Vision Kenya periodically updates the data as well to track progress toward getting 100 percent of residents in these villages suitable WASH services.

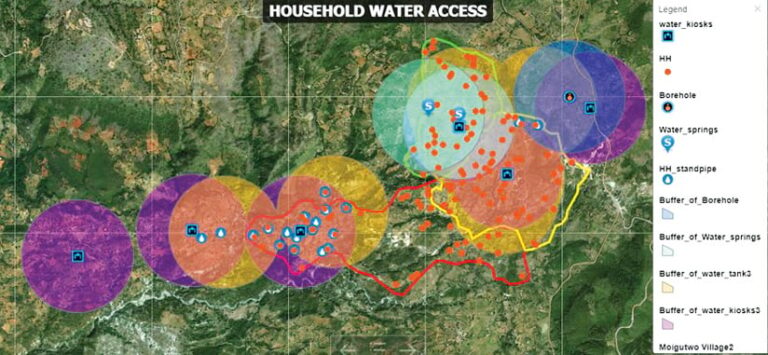
“We used ArcGIS Pro to map the exact location of WASH assets, households, community education and health facilities, and village boundaries, which allowed us to easily see their geographic distribution in the villages,” Atandi explained. “We created 500-meter buffers around water points in the villages to determine which households were outside the recommended distance from safe drinking water. It is estimated that it takes 30 minutes to walk to and from a water point that is 500 meters away. So the buffer zones were created based on the assumption that households would collect water within a radius of 500 meters from a water point.”
Because people do not necessarily walk in a straight line, the team generated overlapping buffer zones to provide different water point locations where community members could collect water based on other factors, such as convenience and proximity to other amenities.
“Our geodatabase includes a unique identifier for each household and WASH asset,” said Atandi. “The data was centralized in an ArcGIS Online server on the World Vision International account. Data was visualized on [a] dashboard [to get] summary statistics on performance across the different indicators. It was also exported and visualized in ArcGIS Online [to do] advanced analyses, such as proximity analysis and overlay analysis. This helped provide a basis for future targeted interventions in those areas with inadequate water and sanitation facilities.”
The team also employed ArcGIS Geostatistical Analyst and the IBM SPSS Statistics software platform to perform inferential statistical analysis and develop summary data by percentages.
Based on the study, the team at World Vision Kenya was able to determine that, for drinking water, community members use public taps 35.4 percent of the time, protected springs 27 percent of the time, individual connections to water sources 19 percent of the time, shared taps 4.6 percent of the time, and unimproved sources like unprotected wells 14 percent of the time. In total, 85.4 percent of households in the villages have drinking water available from an improved water source within a 30-minute round-trip walk. And further analysis done in each village shows that 93.8 percent of households in Mogoi, 91 percent of households in Moigutwo, and 74.4 percent of households in Chesim access water from improved sources.
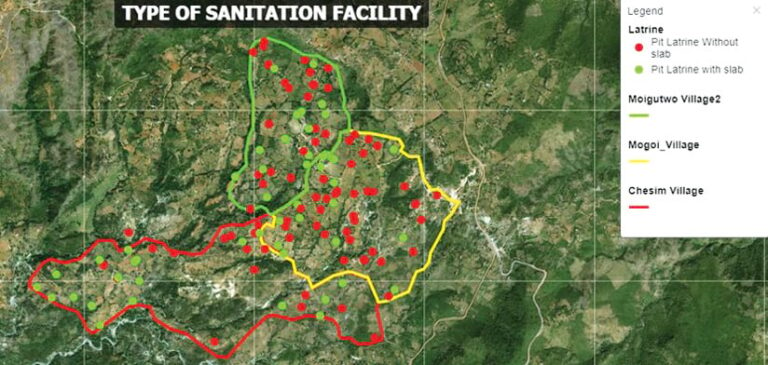
As far as sanitation goes, the analysis shows that, collectively, 98.5 percent of community members in these three villages own latrines and that 97.5 percent of the latrines are functional and in use. The majority of households that have latrines—68 percent—have pit latrines with a slab for seating, while 32 percent are without a slab. For all three villages combined, 32 percent of residents have basic sanitation facilities, 63 percent have improved sanitation amenities, 4 percent have shared sanitation resources, and 1 percent engage in open defecation.

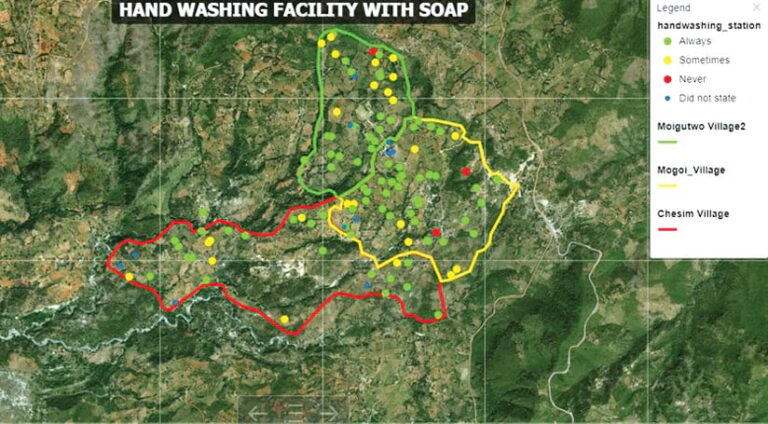
The study also indicates that 86.9 percent of households in Mogoi, Moigutwo, and Chesim have handwashing facilities. Of these handwashing stations, 75 percent have at least water, and 60 percent have both soap and water.
Overall, these study results show that the three villages are making headway in achieving the WASH SDG. World Vision Kenya plans to do more targeted interventions using GIS to get additional households access to better water, sanitation, and hygiene facilities.
The leaders of the study—Atandi and Pamela Wamalwa, a monitoring and evaluation specialist for World Vision Kenya—provided community members, government officials, and other NGOs with the results to prompt further study and action. This has enabled the program to be scaled up to hundreds of villages, where GIS-based progress tracking is helping to implement better WASH services for many more households.
“We believe that using GIS at the village level plays a vital role in progressing toward the UN’s SDG goals by targeting the practical needs of communities, especially in underserved areas,” Atandi said. “In addition, this approach encourages communities to take practical action to achieve localized priorities.”
Atandi and Wamalwa plan to use GIS in future work for World Vision Kenya—for example, to advance conservation and climate change mitigation projects, do remote monitoring and progress tracking of community infrastructure projects in real time, and mobilize resources.

