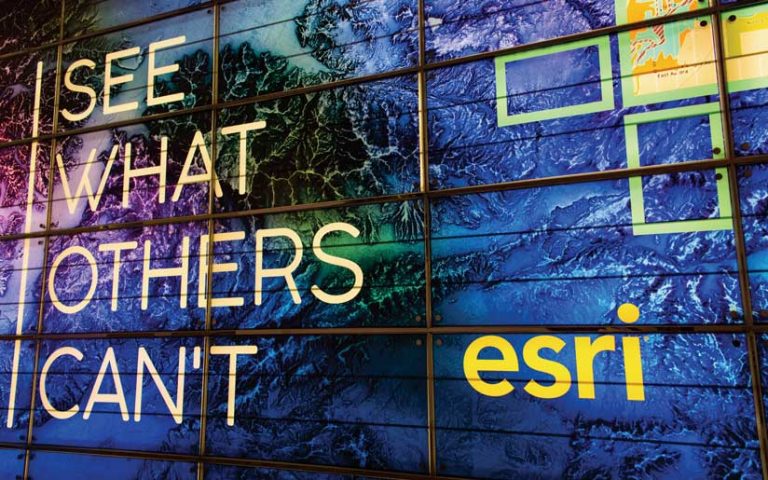
The more than 18,000 people attending the 2019 Esri User Conference (Esri UC) in San Diego, California, saw the phrase SEE WHAT OTHERS CAN’T everywhere. It was emblazoned on a banner wrapping around several floors of the Hilton San Diego Bayfront, on the signs and banners blanketing the San Diego Convention Center, and on T-shirts and water bottles handed out to those at the 39th annual conference, held July 8–12.
More than a slogan, this phrase describes the power of GIS. The stories told by Esri software users from government agencies, nonprofits, private companies, and schools on the plenary stage and in presentations throughout the week demonstrated how GIS lets them see relationships, dependencies, and connections that have enabled them to understand the how and why, as well as the where, to make better decisions and respond effectively.
The conference theme, GIS: The Intelligent Nervous System, is built on the metaphor of the human nervous system. As Esri president Jack Dangermond observed, “Our world resembles a living organism in that it is complex, interconnected, self-healing, resilient, and constantly changing. GIS integrates data from many sources and couples it with values and emotions and carries out coordinated response.”
An Intelligent Nervous System for Conservation
During its presentation, NatureServe unveiled its Map of Biodiversity Importance for the United States, providing a high-resolution view of the most imperiled species for the first time.
NatureServe is a nonprofit group that helps guide conservation efforts by providing species-related data, tools, and services. It uses GIS to better see and understand where to find at-risk species in the United States, Canada, and Latin America.
“Using Microsoft cloud computing and Esri’s modern [GIS] tools, we are able to generate, analyze, and share biodiversity data at a pace and scale never before possible,” said Healy Hamilton, NatureServe’s chief scientist. “We’ve stacked these maps to see what we’ve never seen before: We can identify the places that matter for sustaining our nation’s biodiversity,” said Hamilton.
The data for this map was collected over decades by NatureServe’s network of botanists and zoologists. For areas where little or no data has been collected, data science can fill in the gaps through the use of predictive information models for thousands of species.
“With Esri technology and support from Microsoft’s AI for Earth program, we’ve built a spatial modeling infrastructure in the cloud that allows our scientists from New York to Arizona to work together to fill in these blank places on the map,” said Regan Smyth, director of spatial analysis for NatureServe. Watch the plenary presentation by NatureServe [12 minutes].
Traditional Conservation Goes Holistic
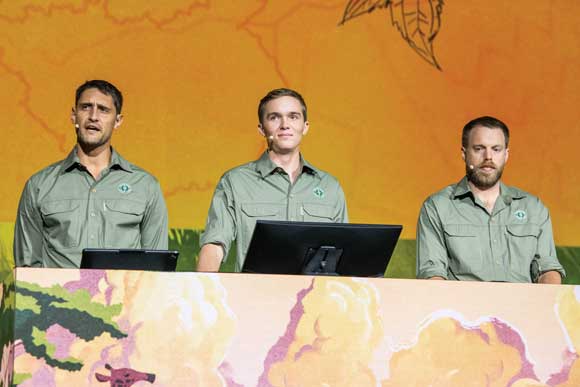
Another presentation described how GIS is preserving species on the other side of the world. To restore and manage protected areas across Africa, the nonprofit African Parks partners with governments and local communities. But it’s a big job that spans 15 parks in nine countries.
“Working at this scale across Africa’s diverse landscape requires holistic and adaptable management,” said Geoff Clinning, African Parks’ technology development manager.
Using a vast network of sensors along with ArcGIS technology, African Parks combines traditional conservation measures with context-based strategies. It fuses “our understanding of the human and ecological landscapes,” explained Naftali Honig, the organization’s director of research and development at Garamba National Park in the Democratic Republic of the Congo.
A problem in Garamba is poaching. By monitoring collared animals, the team can see—in real time—when a herd is acting erratically, which could indicate it is evading poachers. They also map other indicators such as fires or illegal camps. By always knowing where its rangers are, African Parks can quickly dispatch them directly to areas where poachers might be. This has helped reduce elephant poaching in Garamba by more than 90 percent.
African Parks also uses GIS for supporting surrounding communities. For example, outside Rwanda’s Akagera National Park, African Parks started a fishing operation that generates revenue for the community while promoting sustainable fishing.
Treating these unique landscapes as a nervous system—complete with sensory inputs, related analyses, and intelligent actions—is a good start. However, there is still much to do to ensure that Africa’s protected areas thrive for generations. Watch a video of the African Parks plenary presentation [18 minutes] .
Chimpanzees, Insects, and Biodiversity
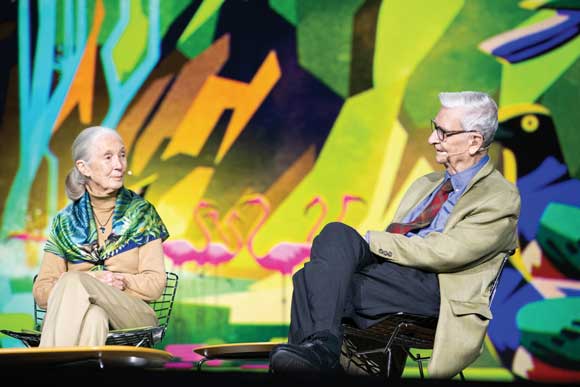
Dangermond moderated an hour of conversation between Jane Goodall, DBE, and founder of the Jane Goodall Institute, and Edward O. Wilson, honorary curator in entomology and university research professor emeritus at Harvard University. The two scientists have worked in very different fields—chimpanzees and ants, respectively—but they share a concern about preserving the Earth’s biodiversity.
Wilson, through his E.O. Wilson Biodiversity Foundation, supports the Half-Earth Project, which has as its goal conserving half the Earth’s lands and seas to protect 85 percent or more of the planet’s biodiversity. Mapping all these species is necessary to better understand every plant and animal.
Goodall said she’s optimistic about biodiversity conservation. Much of her optimism centers around youth, including the young people involved in her Roots and Shoots program, who take on projects such as studying invasive species, biodiversity loss, climate change, and habitat destruction.
“We’ve just got this one blue and green planet. We do have the intellect. If we get together now, we can find ways to deal with the terrible crises that we are in,” she said. Watch the video of this discussion [57 minutes].
Residents Supply and Use Open Data
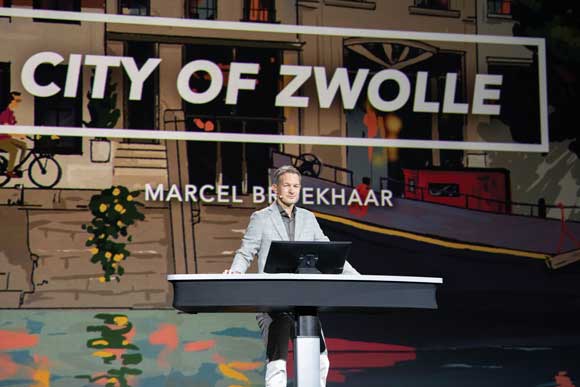
Applying GIS to local as well as global survival was the focus of a presentation about Zwolle, a city in the Netherlands that is prone to flooding. It’s a problem that is only getting worse.
“We need to be resilient to climate change, and GIS is helping us do that,” said Marcel Broekhaar, an adviser for the City of Zwolle’s Smart Zwolle initiative.
The city wanted to involve residents of the Stadshagen neighborhood in flood monitoring, so Broekhaar and his team created an ArcGIS Hub initiative called SensHagen. They built and dispatched weather and air quality sensors and then held an informational meeting for residents to show them how the sensors work and where to access data on the hub.
“[Residents] appreciated that we involved them,” said Broekhaar. “They wanted to participate.”
And they did. Local university students made more sensors. Residents learned how to use SensHagen Hub to make maps and analyze data. People downloaded a Survey123 for ArcGIS app to report standing water. A group of engineers even built wet feet sensors that report flooding directly to the hub.
“What started as a project became an initiative—and is now a movement,” said Broekhaar. Watch Broekhaar’s presentation [9 minutes].
Getting a Census Ready—
and Right
Obtaining citizen participation is also important to the United States Census Bureau. It is a pressing concern, because the 2020 Census is just months away.
“Our goal is to count everyone once, only once, and in the right place,” said Deirdre Dalpiaz Bishop, chief of the US Census Bureau’s geography division. Which is why the bureau has incorporated GIS heavily.
To verify that every state, county, city, tract, block, and address is accounted for, the Census Bureau uses imagery. Census takers, who follow up with nonresponding households, will use an enumeration app, built with ArcGIS Runtime, on iPhones.
“Our route optimizer leverages data from industry leaders, combined with census-specific criteria such as work availability, and calculates [an] optimized case assignment,” said IT specialist Anika Adams-Reefer.
All completed cases will automatically sync to the Census Bureau’s servers, saving time, money, and paper. To help tribal, state, and local governments prioritize census outreach efforts, the bureau is using a configured web app—the Response Outreach Area Mapper, or ROAM. (Learn more about the value of ROAM in this video. [2.14 minutes]) The app lets local leaders identify areas with high predicted nonresponse rates and plan appropriate actions.
“We’re able to make quick, well-informed, and responsible data-driven decisions to help motivate people to respond,” concluded computer mapping specialist Suzanne McArdle. Watch the US Census Bureau presentation [17:37 minutes].
Call to Action
Dangermond emphasized that conference attendees should continue applying and developing GIS, saying, “Your work is essential. The geospatial revolution is just beginning. It is going to profoundly transform our world.”
He exhorted them to be more than technologists. “Building an intelligent nervous system is more than just technology. It will take leadership to envision what’s possible through learning, sharing, and collaborating just like you do now, and strategic thinking by engaging communities, getting it together, and also—above all—a passion for creating a better world. It will take leveraging The Science of Where to SEE WHAT OTHERS CAN’T.”
Although this article provided only highlights from the daylong plenary session, recordings of these and other presentations are available at the Esri Events YouTube channel.
To learn even more about some of the organizations that presented on the plenary stage, see ArcNews articles on the City of Pasadena and the Geneva International Centre for Humanitarian Demining.