A good urban growth prediction model empowers city planners to make informed urban policy decisions and assists investors in making profitable choices. Although the resultant monetary and social benefits can be large, it is difficult to quantify them.
The authors—Witold Fraczek, Jian Lange, and Carsten Lange—worked together on a project to develop a workflow and build a machine learning model for identifying locations with a higher probability of urban development.
Fraczek and Jian Lange are trained GIS professionals who work for Esri, use ArcGIS products daily, and are proficient with geospatial technology. Both prefer to work with ArcGIS Pro. Carsten Lange is a professor of economics who specializes in data science and machine learning. He uses the R programming language for statistical computing with RStudio to solve data science problems.
Which areas would be most suitable for urbanization?
How probable is urban development in a specific area?
Answers to these questions can benefit government agencies, such as planning departments, that need a deeper understanding of urban growth to make better policies. Using predictions from the model, areas not currently zoned for development but likely to be urbanized might be good candidates for development, although other factors, such as environmental impacts, must be considered. Private investors looking for opportunities to invest in real estate and commercial infrastructure can use the model to locate suitable areas.
The availability of large datasets, advanced spatial analysis, and machine learning tools allow data analysts to combine technologies to take predictive analytics to the next level. Existing research about predicting urban development often requires working with more than one type of software. The exchange of large datasets between different software applications complicates the data infrastructure and data exchange between collaborators.
The project was initiated by Fraczek. He selected and preprocessed raster data from the National Land Cover Database (NLCD) for 2001 and 2016. The data was processed with ArcGIS Pro and stored in a geodatabase.
ArcGIS Pro and various R packages were used in creating the predictive analysis model, which assessed the effects of factors such as terrain characteristics; projected population growth; and proximity to roads, urban centers, an environmental areas that are protected.
In the early stages of the project, data was exchanged between ArcGIS Pro and R using comma-separated value (CSV) files as an intermediate step. This hindered project development and collaboration because whenever a change in the underlying GIS raster data was needed, several intermediate datasets had to be recreated, stored, and exchanged.
Introducing R-ArcGIS Bridge automated many processes and changes to the underlying GIS infrastructure. This dramatically helped the collaborators develop the project. R-ArcGIS Bridge is an Esri R package that allows data to seamlessly pass between ArcGIS Pro and R. The powerful spatial data processing and advanced mapping capabilities in ArcGIS Pro could easily be combined with statistical computing in R.
Project Scope
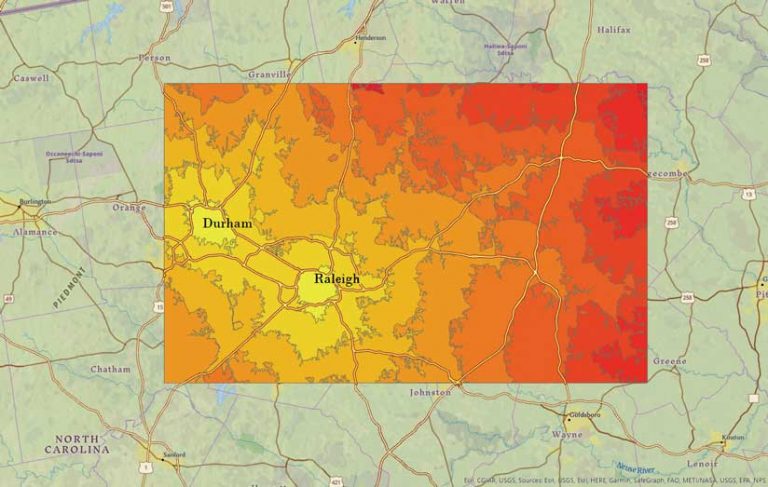
The study area for this prototype project is the Research Triangle (The Triangle) in North Carolina. This region of approximately 3,744 square miles encompasses North Carolina State University, Duke University, and the University of North Carolina at Chapel Hill. This region was chosen based on its relatively limited size, which would cut down computer processing time for spatial operations. The land-use patterns in The Triangle are geographically typical for the United States.
Project Data
Like most statistical procedures, machine learning is based on analyzing past patterns to uncover future patterns. This study obtained land-cover raster data from NLCD and compared land cover for 2001 to land cover for 2016 with the goal of revealing patterns that could be used to forecast urban development.
As population grows, new areas must be converted to urban land use. To identify areas of urban growth, ArcGIS Pro was used to recategorize raster datasets for 2001 and 2016 into urban and nonurban land-use types. Next a new raster dataset (ChangedToUrban) was added to the geodatabase. Cells categorized as nonurban in both 2001 and 2016 were categorized as ChangedToUrban=NO. Cells categorized nonurban in 2001 that changed to urban in 2016 were categorized as ChangedToUrban=YES. Cells categorized as already being urban in 2001 were not considered because the project’s focus was on urban growth.
The original NLCD dataset has a resolution of 30 meters. The subset used for the study area consists of 10.6 million cells, which is an area of 4,143 cells by 2,570 cells. From that study area, 1.7 million cells that were already urbanized in 2001 were not considered. The remaining 8.9 million cells either stayed nonurban or changed to urban between 2001 and 2016.
To prepare the explanatory factors for the predictive model, ArcGIS Pro was used to create seven new raster layers for the study area:
- Drive time to the nearest urban center
- Proximity to the nearest freeway
- Proximity to the nearest secondary road
- Proximity to the nearest environmentally protected area
- Location in a flood zone
- Predicted population growth for the raster cell area as a percentage
- Terrain slope in degrees
Predictive Model
Random Forest, a supervised machine learning algorithm based on multiple decision trees, was chosen to predict urban development. [For more information about Random Forest, see the accompanying article “Seeing the Random Forest in the Decision Trees.”] The model was trained in R because the Random Forest-based Classification and Regression tool in ArcGIS Pro 2.6 does not output probabilities. Random Forest model training was based on the explanatory factors stored in the seven explanatory raster datasets plus the ChangedToUrban dataset as the response variable.
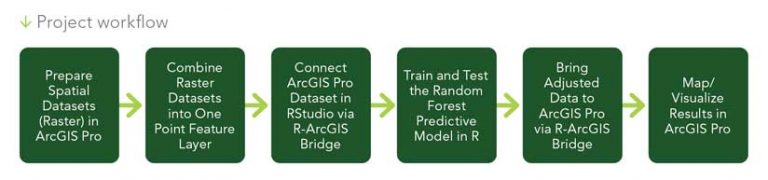
Workflow
The eight spatial datasets (i.e., the ChangedToUrban dataset plus seven explanatory datasets) were prepared and processed in ArcGIS Pro. The raster datasets were converted into a single point feature layer, which was passed via R-ArcGIS Bridge to R as an R data frame. R was used to train and test the Random Forest model and create predictions. Finally, the predictions were passed back to ArcGIS Pro via the R-ArcGIS Bridge to visualize the results.
Preparing Spatial Data in ArcGIS Pro
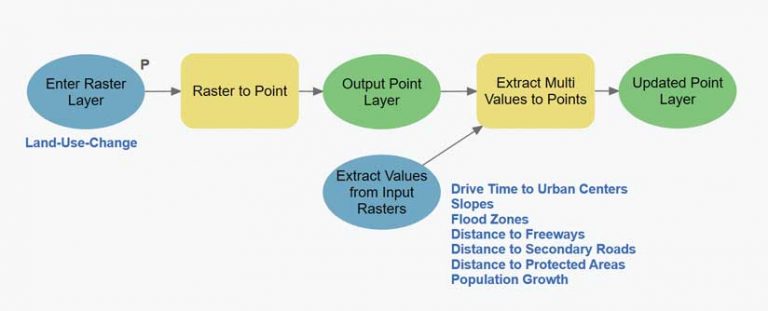
To pass the eight spatial datasets into one R data frame, all variables needed to be in one attribute table. This was done by creating a point feature layer in ArcGIS Pro with ModelBuilder, which automated the process and documented the steps. The Raster to Point conversion tool was applied to the ChangedToUrban raster to save a point feature class in the file geodatabase. The output feature class contained an attribute—also named ChangedToUrban—with a value of NO for cells that stayed-non-urban cells and YES for changed-to-urban cells. The ChangedToUrban attribute was used later in the predictive model as the variable to be predicted.
The Extract Multi Values to Points tool in the ArcGIS Spatial Analyst extension was used to add the explanatory variables to the point feature class. It extracted values from the seven explanatory raster layers at the location of each point and stored them as attributes in the point feature class table.
The resultant point feature class had 8.9 million records with attributes that included Point ID, the response variable ChangedToUrban, and the seven explanatory variables.
Connect Spatial Data from ArcGIS Pro to RStudio
Passing the point feature class to R using R-ArcGIS Bridge required setting up R-ArcGIS Bridge on a computer on which R, RStudio, and ArcGIS Pro were already installed. (R-ArcGIS Bridge can be set up using the R-ArcGIS Support option on the Geoprocessing tab.)
Once the R-ArcGIS Bridge was set up, RStudio was started and the ArcGIS binding package loaded along with other packages. The data transfer process started with the function arc.check_product(), which binds the RStudio session to the ArcGIS installation. To pass the feature class attributes to an R data frame, the function arc.open() was run with the name of the feature class and its full path to connect the feature class to an R variable. Then, arc.select() was used to pass the feature class attributes to the R data frame DataAllFromPro.
Training and Testing in R
With the established connection between the ArcGIS feature class and the R data frame, R can dynamically access the spatial data and train a Random Forest model to predict urban development based on the explanatory variables. Not all data was used to train the Random Forest model. The dataset was split into training and test data. The training data consists of 85 percent randomly chosen records. The remaining 15 percent of the data is held back as testing data to validate the model’s performance.
Before applying the Random Forest model, one problem needed to be addressed: the dataset was unbalanced. Most areas (99.9 percent) that were undeveloped in 2001 remained undeveloped in 2016. Only 0.01 percent of the records changed from undeveloped in 2001 to developed in 2016.
Because machine learning models tend to choose the easiest solution, the model would predict no change to urban for all cells, given that this was a highly unbalanced dataset. This would lead to an absurd accuracy rate of 99.9 percent.
To solve the problem, the Synthetic Minority Oversampling Technique (SMOTE), from the DMwR-package in R was used to generate a more balanced dataset. SMOTE randomly deletes records from the majority class, which was ChangedToUrban=NO, and then uses a k-Nearest-Neighbors algorithm to artificially create new records for the minority class, which was ChangedToUrban=YES.
In the original training dataset, the majority class consisted of 7,427,248 records, while the minority class consisted of only 9,038 records. After SMOTE was applied, the majority class was reduced to 36,152 records, while the minority class was increased threefold to 27,114 records. The balanced training dataset was then used to train the Random Forest model.
The trained model was used on the test dataset to predict if each record changed from non-urban to urban. Since the true values were already contained in the test dataset, they could be compared with the predicted values to gauge the accuracy of the model for the complete test dataset. From the 1,310,690 records in the test dataset that did not change to urban, 1,245,362 records were predicted correctly (95 percent). From the 1,594 records in the test dataset that did change to urban, 1,421 records were predicted correctly (89 percent).
To visualize the predictions in ArcGIS Pro for the study area, the trained model was used to predict the entire study area of 8.9 million records. The resulting data frame, which includes the predicted values and related probabilities, needed to be transferred back to ArcGIS Pro.

Bringing Data Back into ArcGIS Pro
In RStudio, arc.write() was used to write the data frame from R to the original geodatabase in ArcGIS. The resulting table in ArcGIS included columns containing the prediction results from the Random Forest model and included the predicted probability for each record to change from non-urban to urban.
The ArcGIS Pro table imported from R was joined to the original point feature class based on the common Point ID, using the Add Join tool in ArcGIS Pro, then a raster layer was created based on the joined point feature using the Point to Raster tool in ArcGIS Pro.
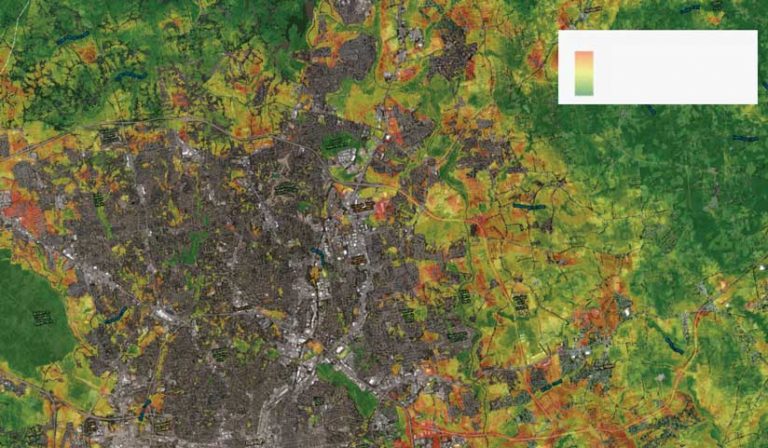
Visualizing Prediction Results
The advanced cartographic capabilities in ArcGIS Pro makes it ideal for mapping and visually evaluating the prediction results. The predicted patterns were as expected. Predicted urbanization areas were located close to existing developed areas and roads. What was interesting was that some of the areas that were predicted to have a high probability for urban growth—based on 2016 NLCD data—were confirmed by the 2020 satellite imagery in the basemap used for mapping.
Summary
This project with ArcGIS Pro and R achieved its objective: predicting urban growth in the study area. The team integrated knowledge and skills from GIS and data science to make this project successful. R-ArcGIS Bridge was a key component in creating a smooth workflow. It allowed R to dynamically access ArcGIS Pro data and save R results back to an ArcGIS dataset.
This prototype showed promising prediction results. However, there is room for further research. For example, in this project, the predicted urban growth included residential and commercial urban developments. Since some explanatory variables, such as distance to freeways or airports, may have opposite effects on residential and commercial development, it might be better to perform separate predictions for these urban types, although this would also reduce the records for each analysis. A follow-up project might shed more light on these issues.
About the authors

Jian Lange

Carston Lange