Shocked patrons read the “We Are Closed for Business” sign on the locked door of a darkened restaurant. This scenario is a common one in many communities. More serious than the closing of a favorite gathering place was the impact on the city’s local business environment. More than 100 people were suddenly unemployed, business and tax revenues were lost, and a large building stood empty. Empty buildings that once housed businesses drag down the prosperity of the community.
Local economic development agencies need to attract new businesses to empty sites as soon as possible, but where to start? How to transform the site of a failed business into an enticing location with tons of potential?
The answer: Show them the data. But what kind of data?
Data about the types of people who live, work, and shop near a site is gold to potential business operators. To better assess the viability of business, they need data that answers basic questions about the demographics, lifestyles, and spending habits of the population in an area.
Who Are They? (Demographics)
Esri’s updated demographic data provides the characteristics of a population by giving a breakdown of variables such as age, gender, income, housing, family type, education, and employment. This kind of information can characterize populations and answer questions like:
- Are they retirees or young families?
- Are the majority single or married?
- Do they have children?
- Do they have significant disposable income or are they struggling to get by?
- Are they new arrivals or have they lived in the area for a long time?
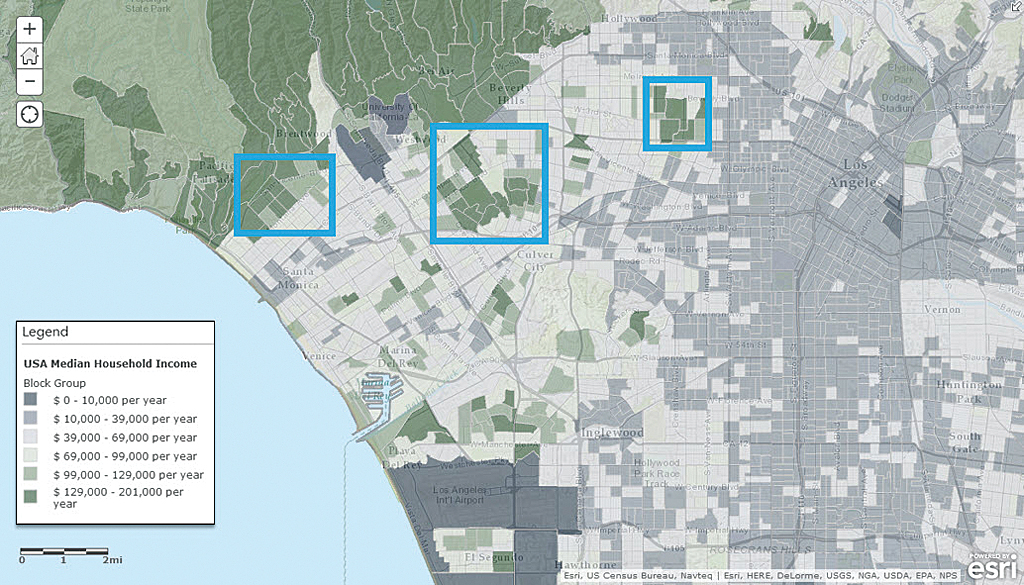
This type of information enables a city’s economic development staff to better promote a site by showing prospects a real and quantified description of the types of customers that are nearby. Analysts can provide maps based on the demographics of age, income, and household type that show who lives where.
When evaluating the potential of an area, this type of demographic data lets analysts consider groups, like seniors or daytime populations that work in the area, separately as additional revenue sources. With this information, economic development staff can see the types of restaurants that do well. Conversely, restaurant development companies can locate areas that contain populations within targeted income or age ranges.
What Do They Do? (Lifestyles)
While household income visualized on a map is a good start, for more detailed information about the preferences and habits of a population, lifestyle data (also called segmentation data) can be added to demographics.
Lifestyle data adds a new perspective to demographics. It is based on the principle that people with similar tastes and lifestyles are likely to seek others like themselves and cluster together in a community. People typically move through various life stages: they marry, have children, become empty-nesters, and retire. They tend to relocate in neighborhoods where others who are at a similar stage live. Even though individual residents may come and go, a neighborhood’s character, once established, tends to remain stable over time.
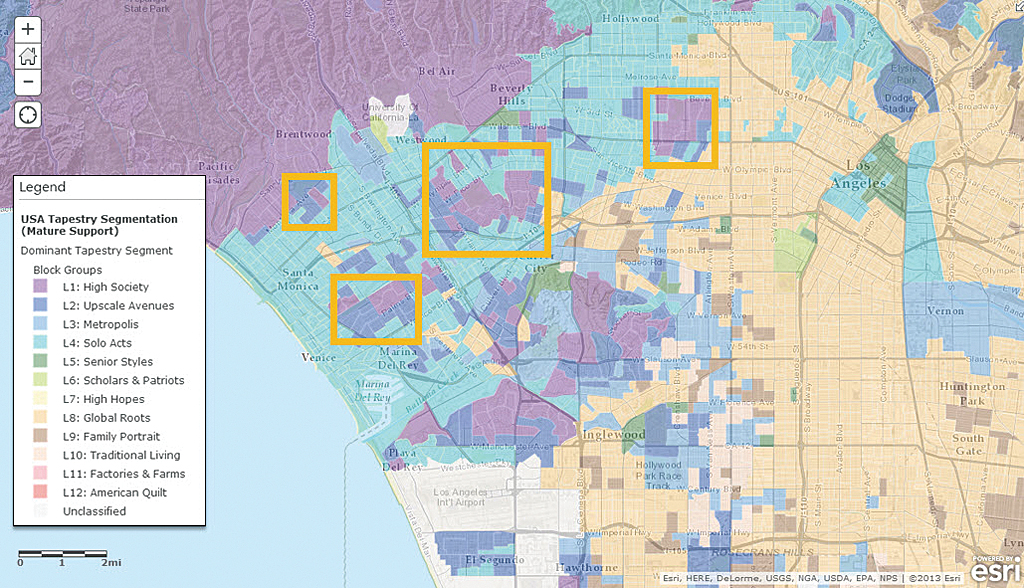
After using Esri’s Tapestry Segmentation data to identify the types of neighborhoods in the area, the city staff in this example might learn that the typical resident near the closed restaurant likes sports; watches movies at home; eats out fairly often at family-type restaurants; drives a moderately priced vehicle; and goes online for information, banking, and shopping.
Adding this information to the mapping analysis could narrow the types of prospective restaurants and allow the city to pitch the site to businesses likely to find the site appealing. Armed with lifestyle information, the staff could show restaurant chains not only the demographics of the targeted areas but also their lifestyle and media preferences. This information provides valuable insights into the likelihood that residents in an area will eat out and the best ways to communicate with them.
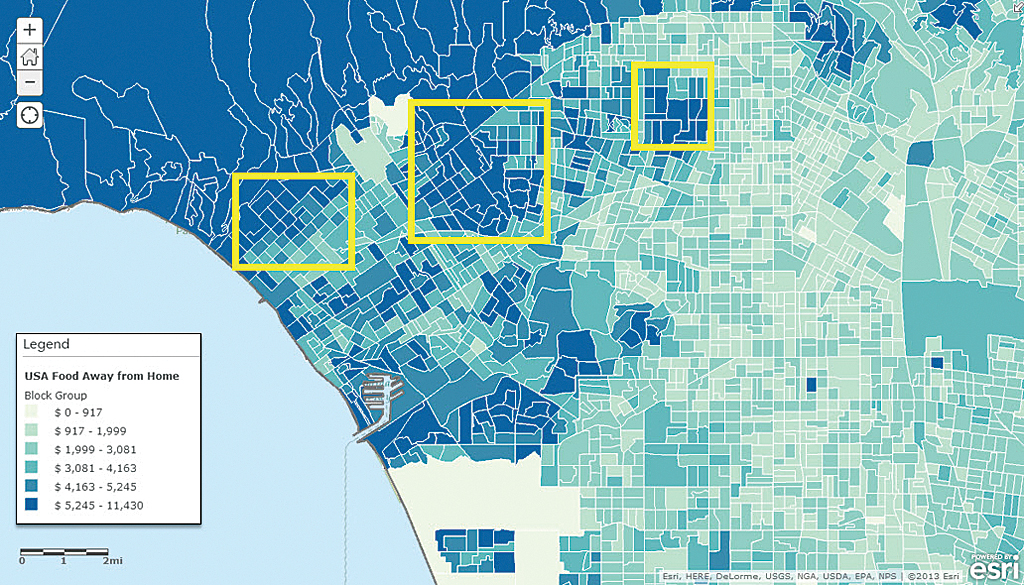
How Do They Spend Their Money? (Spending data)
Spending data provides detailed information on how the local population uses its income. Esri’s Consumer Spending data compares spending by households in an area for a variety of categories to the national averages for those same categories. Market Potential data measures area demand to national averages. Studying the indexes for each database can help determine actual spending by adult or household, and the potential demand for different types of restaurants.
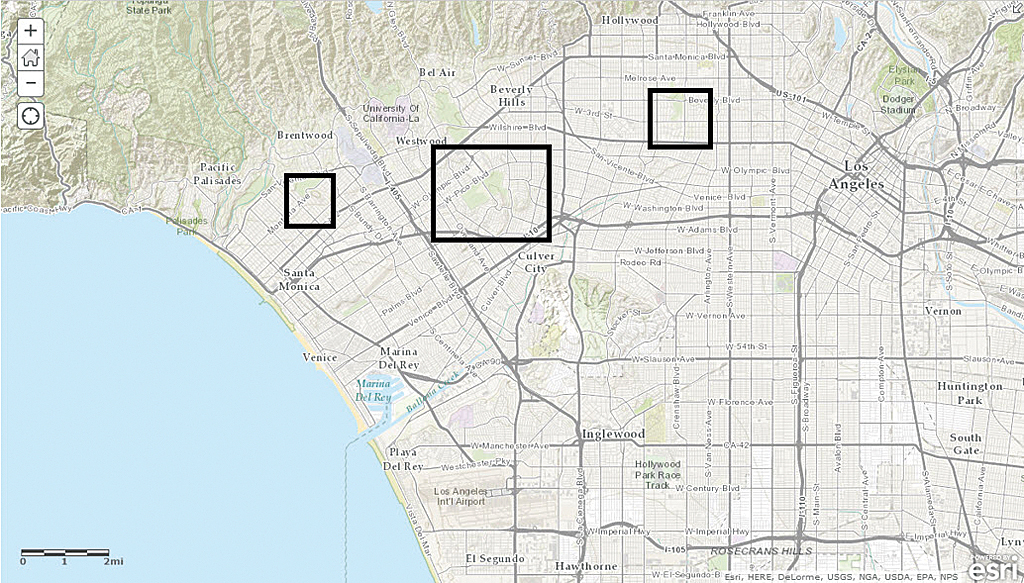
Site Selection Analysis
Location is a critical element for any site selection or trade area analysis. Studying the competitive landscape is necessary to ensure that a new restaurant wouldn’t cannibalize current ones. When the staff members in this scenario ran Esri’s Business Locations data for restaurants in the area, they found everything from fast-food to fancy sit-down places and determined a new restaurant in the empty location could be viable and would not damage the business of existing restaurants.
Drive time—how far people would drive—was also considered. Most of the targeted population live within 20 minutes of the site. Proximity to an interstate and a rather upscale shopping area were added assets.
Putting It All Together
Incorporating demographic, lifestyle, spending maps, and the other information in the analysis enabled the staff to quickly see the types of restaurant companies they should focus on in promoting the empty building. A family-style restaurant with a varied menu and a bar where patrons could visit and watch sports would be a good candidate for the site in this scenario. Staff members compiled a list of restaurants that met the criteria and created presentations illustrated with charts and maps.
Demographics, lifestyle, and spending data can provide answers to the who, what, where, and how questions that businesses can use to evaluate potential sites efficiently and avoid a scattershot approach. This information can also help cities market commercial sites by identifying and pitching to businesses that would be a good fit for an area. In either case, data, spatial analysis, and maps provide actionable answers to business questions.
For more information, visit the following sites: