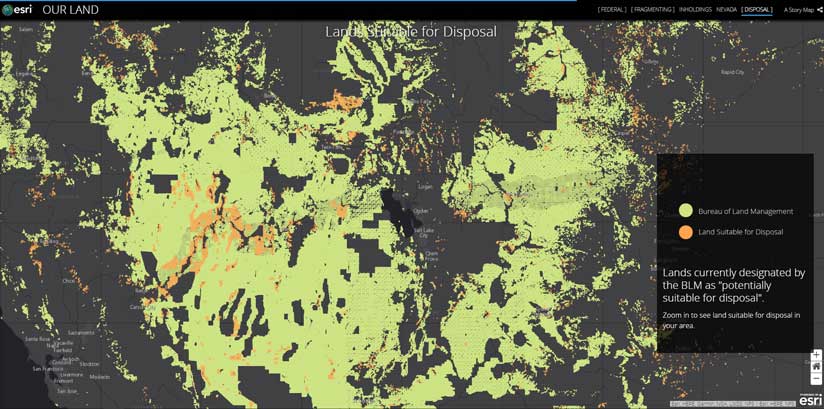
At the University of Arizona, a GIS team in the Advanced Resource Technology Lab in the College of Agricultural and Life Sciences was tasked with exploring the potential effects of national-level legislation that seeks to make federal landholdings more manageable by targeting lands that have been identified by the Bureau of Land Management (BLM) as “lands potentially suitable for disposal.”
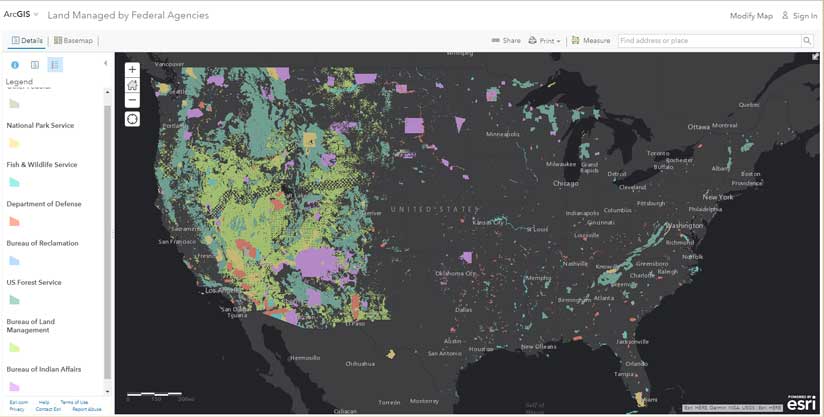
Almost a third of the land in the United States is managed by the federal government. Federally owned land is mostly managed by four agencies: the Bureau of Land Management (BLM), the US Forest Service (USFS), the US Fish and Wildlife Service (FWS), and US National Park Service (NPS). These agencies are generally dedicated to the preservation of wildlife and ecosystems; recreation; and development of natural resources such as grazing, timber, and mining.
Historical transfer of land from federal ownership to railroads, other private owners, and states has left a patchwork of federal holdings. Proposed legislation such as the Hunting, Education, and Recreational Development Act (H.R. 3333), or HEARD Act, seeks at the national level to reduce this fragmentation to make federal land more manageable. The HEARD Act proposes to require the BLM to sell 80 percent of this land over four years.
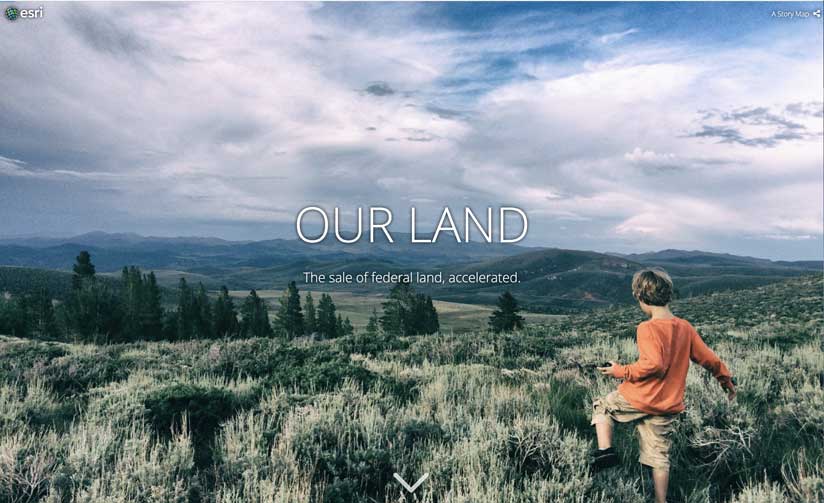
The project team exploring the effects of this legislation was led by Cody Sheehy, an award-winning videographer. Sheehy interviewed stakeholders and experts while the GIS team collected and evaluated existing geospatial data sources. Together they created an Esri Story Maps app called “OUR LAND: The sale of federal land, accelerated” (OurLand.arizona.edu) to bring this information to a wider audience.
Locating the Data
The first step in understanding the effects of this ongoing legislation was to find out the total amount of land under consideration. The geospatial data for the land managed by each federal agency—BLM, USFS, FWS, NPS—is available from a public database provided by the federal government. Grazing allotments, municipal boundaries, cultivated land, and development areas data was also retrieved from public databases provided by the federal government.
Direct sources of this information were the BLM Resource Management Plans (RMPs). They are land management blueprints that are available as documents with text and maps through the online e-planning portal at eplanning.blm.gov. In some RMPs, parcels are clearly identified as potentially suitable for disposal because these RMPs have legal descriptions of the land tracts in the United States Public Land Survey System (PLSS) that include township, range, section, and the portion of the section.
The BLM Southern Nevada District Office, which manages the BLM land in the Las Vegas Valley, partners with the BLM Lands, Realty and Cadastral Survey Program to make information about land sales publicly available through its website at blm.gov/snplma. Since the Southern Nevada Public Land Management Act (SNPLMA) of 1998, the BLM has sold 35,000 acres at auction in the Las Vegas Valley. The field office also provided the team with the geospatial data to calculate how much land potentially suitable for disposal remains. The answer: 30,000 acres. While geospatial data was not available from any other state BLM office, individual field offices provided further details about the areas they manage.
The team asked how much land potentially suitable for disposal exists in each state and how much of this disposal land exists for the entire United States. From interviews and correspondence with BLM staff, it was clear that only the western half of the United States has a significant amount of land that could be affected by the legislation. There is a BLM office for each of the 12 western states (except for the Montana/Dakotas office) and one office for the whole eastern part of the United States. Because it is still receiving its statehood and native settlement claims transfers, Alaska is a different story.
To determine the amount of affected land for the entire nation, it was necessary to acquire geospatial data for land designated as potentially suitable for disposal from the rest of the states. When contacted, some states provided data aggregated at the state level. The national BLM office responded to the team and explained that it had reached out to each state office in fall 2017 and aggregated the lands potentially suitable for disposal for the whole United States.
However, an officer from the Washington, DC, office informed the team that BLM headquarters had not finished quality checks to identify errors or omissions in the dataset. Also, not all field offices were included with updated information, solely on the basis of different timelines. The Las Vegas Field Office, for example, completed an RMP as recently as 2015, while the most recent RMP for a different Nevada field office is 1985. BLM staff reported that field offices are loosely required to update RMPs every decade. This inconsistency was a reality when using the data. In response to the variability in the published RMPs, the data had to be integrated before analysis.
Finding the Real Parcels
Essentially, datasets for both BLM land and BLM parcels suitable for disposal came as multipart polygon feature classes because the method used to create those polygons, as well as the data itself, was not previously scrubbed and cleaned for analysis. To make the data ready for statistical analysis of the acreage for each land parcel and its proximity to surrounding land use, the Multipart to Singlepart tool was used several times to explode multipart polygons into single-part polygons. Taking BLM land polygons in Arizona as an example, all BLM land parcels were originally one large multipart polygon. After explosion, land parcels were split into 2,000 single-part polygons with shared attributes inherited from the “mother” polygon.
After exploding the BLM land feature class and BLM land suitable for disposal feature class, all single-part polygons were grouped by state boundaries for easier accessibility and reduced volume for data processing. At that time, the team discovered a significant number of seemingly invalid polygons by reviewing the attribute for BLM land and BLM land suitable for disposal single-part polygons state by state. In many cases, the polygons of BLM land suitable for disposal did not align with BLM land polygons. Some were too small to be valid polygons for land management agencies, and some were sliver polygons. Sliver polygons were probably caused when the original feature classes were created based on PLSS, which is widely used by federal land management agencies. To increase the accuracy of the statistical and proximity analyses of the data, these small and sliver polygons had to be eliminated.
After carefully reviewing attribute tables for BLM land and BLM land suitable for disposal feature classes for all states, the team agreed to eliminate any polygon that was less than one acre, since these parcels were potentially too small and fragmented for the BLM to manage. The team used the Thinness Ratio (4 * 3.14 * (Area / Perimeter ^ 2)) to determine which polygons were potentially too thin to be valid and thus were sliver polygons. Any polygon that had less than a 0.3 Thinness Ratio and less than five acres was manually examined and eliminated if it was a sliver polygon. Once sliver polygons were removed, the actual area could be calculated. The BLM currently has listed 10.7 million acres in this category, which is roughly the size of Denmark. Under proposed legislation, 80 percent of these acres would be sold within four years.
Besides the BLM parcel data, other spatial data used to support proximity analysis was processed for better usability. The grazing allotments feature class, obtained from the BLM Navigator website (navigator.blm.gov) was spliced by state boundaries. Categories other than development area and cultivated land were removed from the US Department of Agriculture Cultivated Land raster dataset. Development areas and cultivated land were then subset by state boundaries and vectorized for later proximity analysis.
Data Analysis
To characterize the relationship between BLM land and land suitable for disposal, both feature classes were overlaid with the municipal boundaries and grazing allotments for each state. The overlays, however, did not reveal the reason BLM marked those lands as suitable for disposal, other than most BLM land and land suitable for disposal is grazed and only a small amount is located within municipal boundaries. As a result, a more specific proximity analysis was performed to examine the distance from BLM land suitable for disposal to nearest developed area (e.g., roads, commercial and residential land use, and other infrastructure) or nearest agricultural area (cultivated land).
Efforts were made to perform a fragmentation analysis for BLM land and land suitable for disposal. Unlike many previous fragmentation analyses conducted from agricultural and ecological studies, the spatial extent of the study area became the main problem for applying existing algorithms. Although the team did not calculate fragmentation indices for all BLM land and land suitable for disposal, based on the manual inspection of dispersed spatial patterns, it is certain that fragmentation existed in both BLM land and land suitable for disposal parcels.
Key Findings
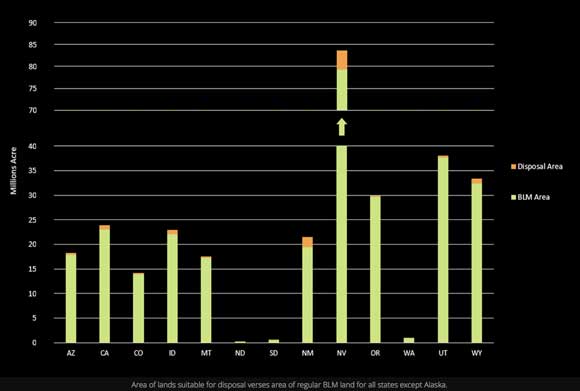
From the statistical analysis of the acreage of BLM land and land suitable for disposal, along with overlay layers with grazing allotments and municipal boundaries, approximately 19.15 percent of all land in the western United States (including Arizona, California, Colorado, Idaho, Montana, North Dakota, South Dakota, New Mexico, Nevada, Oregon, Washington, Utah, and Wyoming) is BLM managed, and only 3.58 percent is designated as potentially suitable for disposal. Approximately 88 percent of BLM land and land suitable for disposal are in grazing allotments. Only 1.05 percent of BLM land and 6 percent of land suitable for disposal are within municipal boundaries. The amount of most BLM lands suitable for disposal is small compared to all BLM land parcels in the western United States.
By comparing and contrasting the mean and median from the proximity analysis of distance from BLM land and land suitable for disposal to the nearest development and agricultural land use, results indicate that, generally, lands suitable for disposal are closer to development and agricultural land-use areas than all BLM lands. Most lands suitable for disposal are closer to development (mostly roads), than agricultural land uses.
To increase comprehension of this analysis and encourage public discussion, the team created an Esri Story Maps app called “OUR LAND: The sale of federal land, accelerated” (OurLand.arizona.edu) that combines data-driven analysis and video journalism. The team believes presenting its research results in a story map will increase public awareness of details and impacts of ongoing legislation and landownership processes.
What’s Next
Although the project did not include research on the market impact of disposing of 10.7 million acres within a few years, it provides enough evidence to open the door for those interested in the real estate market to start looking at the impact on both a local and national scale. The story map invites viewers to explore web maps in ArcGIS Online and take a closer look at the land managed by federal agencies and—for the first time—lands potentially suitable for disposal. This dataset was previously unavailable because the BLM is in the process of aggregating that data nationally. Stakeholders also did not necessarily know what data to look at without the context that the story map provides.
While stakeholders can explore the potential impacts of accelerating the sale of federally owned land, GIS professionals can challenge the unsolved aspects of data analysis. The incompatibility of existing fragmentation indices with a large study area prevents fragmentation analysis on BLM land and land suitable for disposal. It also encourages further study into developing new fragmentation indices and analyses, potentially using algorithms to analyze spatial distribution patterns of land parcels over a large study area.
Using GIS and a story map to create meaning and readable context from geographic data provides a fuller picture of ongoing federal land legislation and informs a wider audience of potential change in landownership and the real estate market.
For more information, contact Emily Marderness and visit the story map at OurLand.arizona.edu.
About the authors

Yao Jian