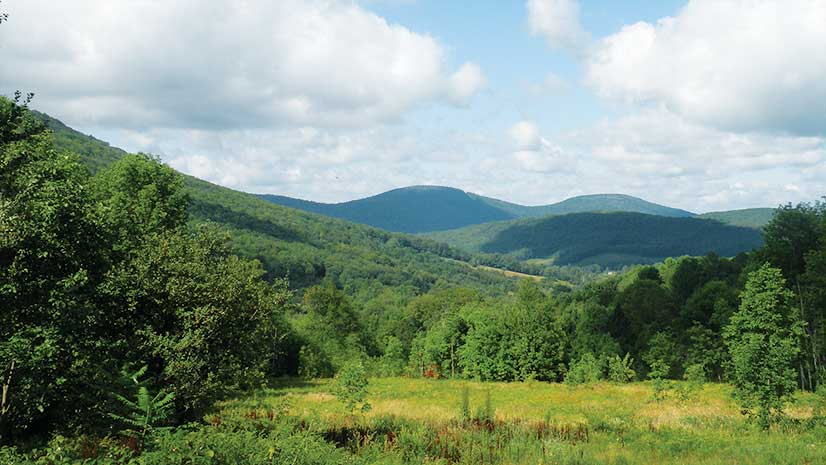
Where is a good place to plant streamside forests? The answer could be, “Just about anywhere.”
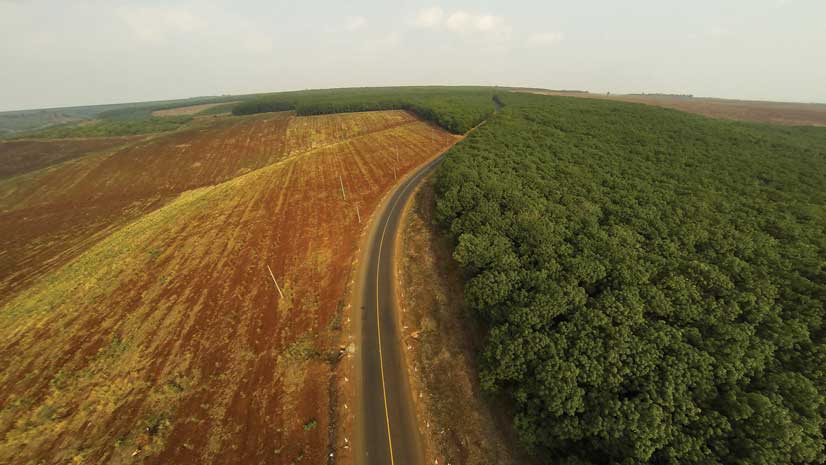
Trees are natural water filters. They improve water quality; reduce flooding impacts; stabilize soils; provide wildlife habitat; and are vital to healthy streams, rivers, and bays. Streamside forests naturally block and break down many pollutants before they ever reach the water.
Although planting trees along streams is one of the most effective ways to improve water quality, establishing them is expensive and time-consuming. Planting alone can cost more than $2,000 per acre, and trees require several years of maintenance to ensure their survival.
Given these costs, it makes sense to select planting sites that maximize the water quality gains of every tree planted. While anywhere along a stream may be adequate, some spots are better than others. Topography, soil, climate, and upland land use all impact how much pollution a given streamside forest can filter. GIS and high-resolution data can help land managers target planting sites to maximize water quality gains for every tree planted.
Using GIS for Planting Planning
Pennsylvania has set an ambitious goal of planting 95,000 acres of streamside forests by 2025. But where are the best spots for those forests? The state turned to GIS for the answer. The result was a comprehensive statewide database of over 200,000 planting opportunities—each ranked by its ability to improve water quality.
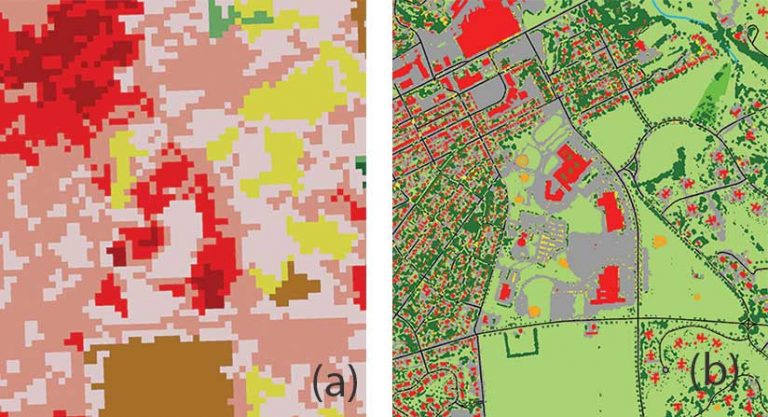
To prioritize planting sites, the first step was to find them. Traditional 30-meter land-cover data from the National Land Cover Database (NLCD) was too coarse for the analysis, so it was replaced with new, 1-meter land-cover data developed for Pennsylvania by the Chesapeake Conservancy and University of Vermont. This new land cover data provided 900 times the precision of the NLCD and allowed for detailed delineation of planting sites. Areas of at least 0.25 acres of low vegetation (plant material less than 2 meters in height) on a single tax parcel were evaluated.
To identify potential planting sites, 1-meter land-cover data was intersected with 100-foot buffers around streams, rivers, and water bodies. All land cover other than low vegetation was removed, and the results were intersected with tax parcels to locate planting sites.
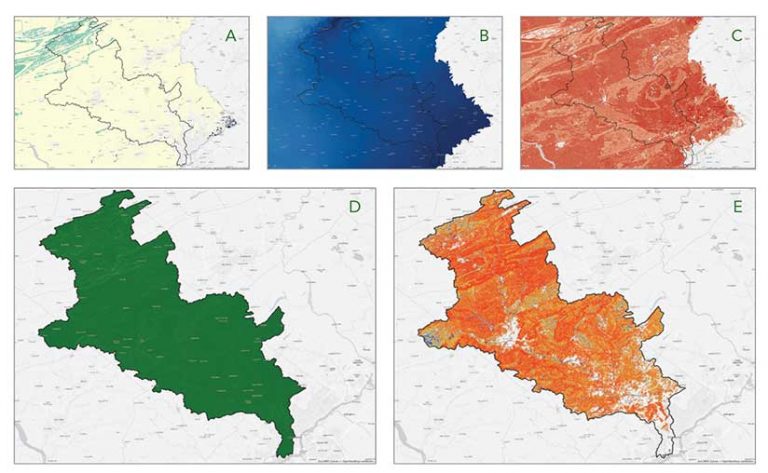
Once planting sites were identified, they were ranked using three criteria:
- Topographic wetness index—How well the site mitigates storm water
- Sediment trapping efficiency—How well the site filters pollution
- Upslope land cover—How much need for pollution control exists at the site
The topographic wetness index uses a digital elevation model (DEM) to calculate how much water flows through a given streamside area on its way to the stream. The more water that flows through an area, the more important a streamside forest is at that location.
To calculate the topographic wetness index, tools available from the ArcGIS Spatial Analyst license for ArcGIS Pro were used. The DEM is corrected using the Fill tool to remove sinks (i.e., erroneous low points in the data). The resultant filled DEM is used to generate a slope raster with the Slope tool. A flow accumulation raster was also created using the Flow Direction and Flow Accumulation tools. This analysis used 3-meter DEM data from Pennsylvania’s PAMAP Program. [The PAMAP Program collects high-resolution digital aerial photographs and lidar elevation data.]

Sediment trapping efficiency assesses how effectively a streamside forest can block pollution delivery to streams via surface and shallow subsurface flow. It uses soils data including median particle size, runoff potential, erodibility, slope length, and slope steepness. The US Natural Resources Conservation Service Gridded Soil Survey Geographic (gSSURGO) Database provided this information. The Raster Calculator in ArcGIS Pro was used to combine the disparate variables into a single sediment trapping efficiency score.
In the last step, identifying the upslope land cover flagged planting sites where upland land uses were more likely to generate pollution. It paired the 1-meter land-cover data with National Hydrography Dataset catchments to identify catchments with higher developed and agricultural land. Planting sites in these catchments received higher scores than those with more natural land covers such as forests.
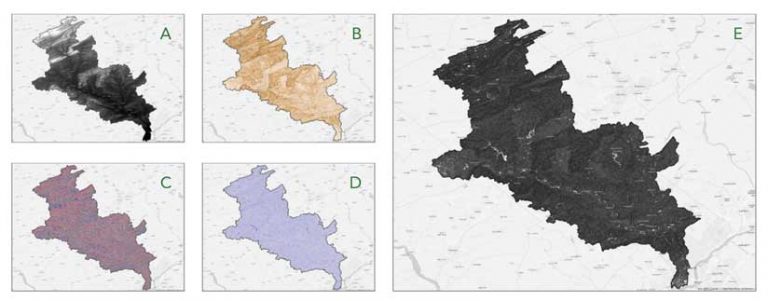
The scores for each criterion ranged from 0–1. These scores were summed into a final score for each planting site. Higher total scores indicated sites that could effectively filter more pollution from a larger amount of water.
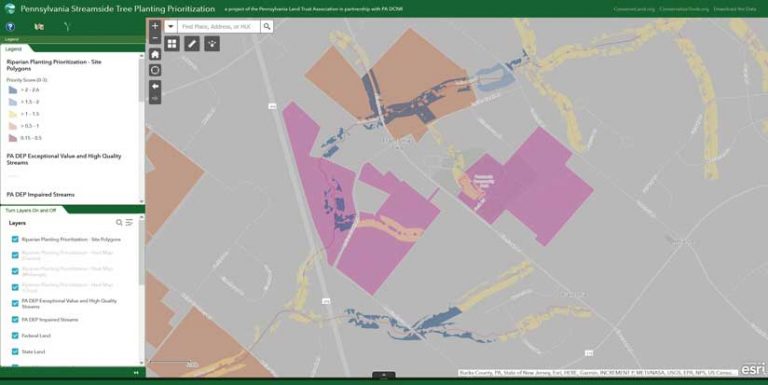
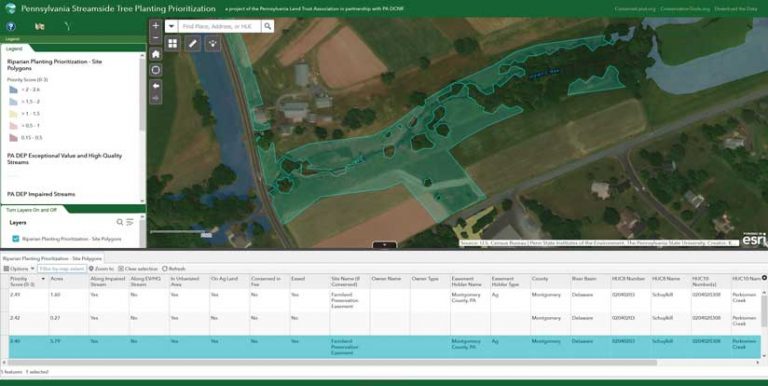
Sites also received qualitative attributes to aid end users in navigating the data. These attributes included geographic regions (county, watershed), stream health (determined by the Pennsylvania Department of Environmental Protection), urbanized areas (from the US Census), and protected land status (based on Pennsylvania’s PA Conserved Land database).
Sharing Results
A key goal of the project was to make results accessible to non-GIS users. The project sought to help local organizations—often volunteer-based conservation groups—find and select planting sites in their communities. To meet this goal, the analysis results were made available in a web app, Pennsylvania Streamside Tree Planting Prioritization. The app was built using Web AppBuilder for ArcGIS. Advanced users can download GIS layers from the Pennsylvania Spatial Data Access website.
The amount of information provided by the dataset made creating a web app challenging. Users needed to efficiently sift through 200,000 potential sites to find a few relevant locations. A combination of heat maps and filters met that requirement while simultaneously reducing the app’s load time.

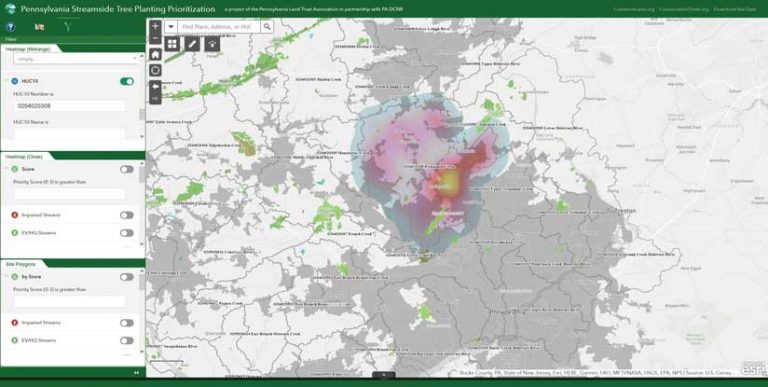

Planting site polygons are only displayed at very large scales. At smaller scales, the point layer displays as a heat map. To accomplish this, site polygons were converted to point features using the Feature To Point tool in ArcGIS Pro.
Heat mapping in ArcGIS Online includes the ability to map based on an attribute as well as by point density. At the smallest scales, map filters limit the points used by the heat map to the highest scoring sites to improve performance. By choosing the site’s score for this attribute, the heat map shows clusters of high-scoring locations, which is ideal for locating planting sites. As users zoom in, the heat map adjusts to continue showing high-scoring areas. The result is a seamless exploration from the statewide to local levels.
Heat maps in ArcGIS Online also respond dynamically to any filters applied to the layer they symbolize. Multiple filters can be applied to the heat map simultaneously. This capability proved essential for tree planters. For example, conservation groups in Pennsylvania often focus on one watershed. By filtering results using either hydrologic unit code (HUC) number or name, these groups can cut through the data noise and find exactly the planting sites they are interested in.
State agencies prefer to plant trees on land that has already been protected from development such as a local park or land with a conservation easement. Filtering the heat map by protected land status allows these users to find clusters of quality protected planting sites on the fly.
Project Benefits
Completed in June 2019, this project took one analyst six months. It is already in use, guiding planting efforts. Recently, staff from the Pennsylvania Department of Conservation and Natural Resources used the data to locate planting opportunities on parks in York County. They then ground truthed the GIS results by visiting several parks. Having validated the data, the agency is applying the GIS model to prioritize planting on state-owned lands.

This project illustrates the dual power of ArcGIS to perform analysis requiring advanced geoprocessing tools, complex math, and high-resolution data and yet communicate the results of that analysis intuitively, using a responsive and easy-to-navigate interface. This will allow Pennsylvania to tailor its conservation investments and ensure that every dollar spent works as hard as it can to make the state’s streams, lakes, and rivers cleaner for everyone.
For more information, contact Josh VanBrakle, GIS specialist for the Pennsylvania Land Trust Association.