Providing valuable groundwater aquifer information
The Environmental Quality Division (EQD) of the City of Jacksonville, Florida, which issues water well construction permits, needed more timely access to accurate aquifer elevation information than was afforded by hard-copy maps.
Since 1978, EQD has issued water well construction permits in Duval County under a cooperative agreement with the St. Johns River Water Management District. Last year, EQD processed more than 1,200 well permit applications for wells serving a variety of purposes including domestic potable, irrigation, geothermal, industrial, environmental monitoring, and limited use public supply wells.

Well permit information is managed using EQD’s Wellhead Information Management System, a custom, web-based application that interfaces with ArcSDE in a Microsoft SQL database. Well location and construction information for each well permit, including real estate parcel, street address, casing diameter, casing depth, and total well depth, are maintained in this database.
Prior to implementing GIS, EQD well permit application reviews depended on hard-copy information contained in paper maps, publications, and other reference materials. In 2004, EQD created the Groundwater Contamination Risk Management GIS using ArcGIS software. It is used to determine if known groundwater contamination issues are present in the vicinity of a proposed well.
Currently maintained in an ArcGIS 10 ArcMap document (MXD), the Groundwater Contamination Risk Management GIS includes contamination site information and private well sampling analytical data collected by state and local government agencies. Access to this information via GIS allows EQD to quickly evaluate potential contamination sources in the vicinity of a proposed well and provide notification to property owners and water well contractors when warranted by site conditions.
Although the ArcMap document was a major step forward in quickly accessing contamination-related data for permit review, EQD staff still relied on hard-copy maps for most hydrogeologic information including subsurface aquifer elevation data. To determine depth to a target aquifer from the available paper maps, the top of aquifer elevation first had to be referenced to the ground surface elevation at the site, which required access to a separate topographic elevation data source.

To improve accessibility to this type data, in spring 2012, EQD began creating a file geodatabase that would provide accurate depth to aquifer data across Duval County. The GIS mapping project focused on the surficial aquifer system (SAS), a productive and relatively shallow limestone aquifer of highly variable depth. EQD used top of aquifer elevation data provided in US Geological Survey (USGS) publications and City of Jacksonville lidar-based, topographic elevation data to create a feature dataset representing the depth to the top of the shallow limestone aquifer.
Local Hydrogeology
Duval County has a unique hydrogeologic setting that includes two other aquifer systems in addition to SAS: the Intermediate aquifer system (IAS), and the Floridan aquifer system (FAS). SAS is primarily composed of unconsolidated sands, clays, and a basal limestone rock unit and ranges in thickness from approximately 50 to 100 feet in much of eastern and central Duval County to more than 200 feet in the western portion of the county.
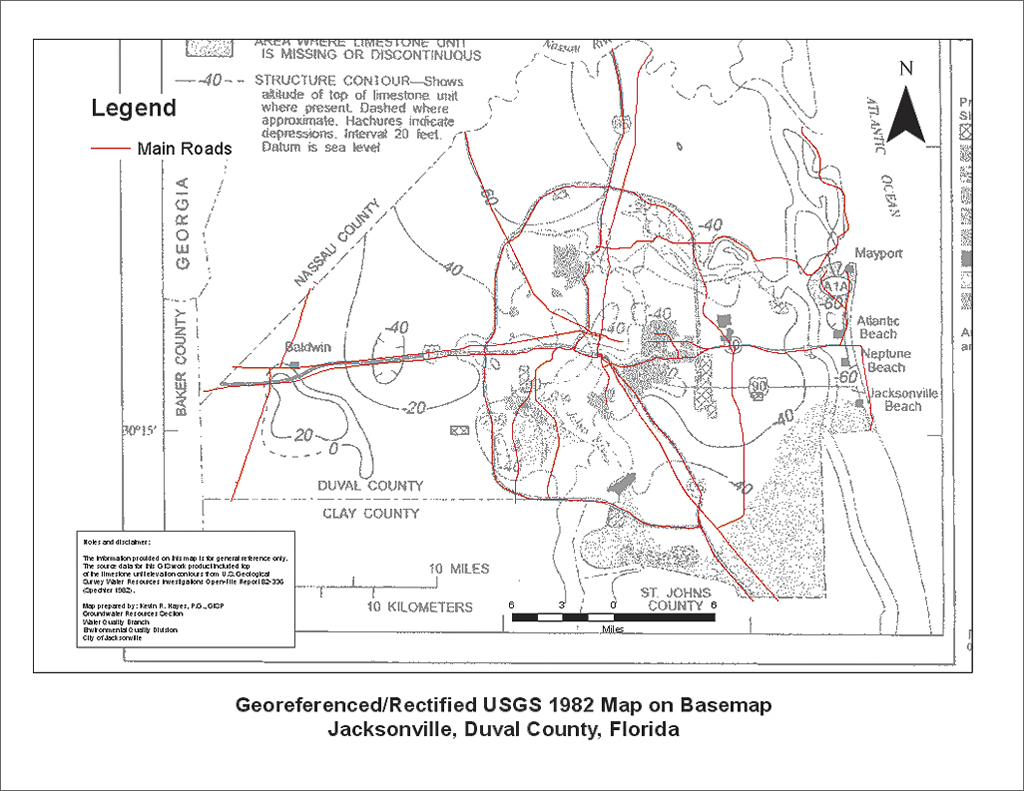
Numerous private, residential potable wells and irrigation wells produce water from SAS, particularly from the limestone aquifer at the base of SAS. According to the 1982 USGS Water Resources Investigation Open File Report 82-336, “Generalized Configuration of the Top of the Limestone Unit of the Lower Part of the Surficial Aquifer, Duval County, Florida,” by Rick M. Spechler, SAS is not present throughout Duval County, and the SAS limestone aquifer generally ranges from approximately 5 to 40 feet in thickness.
Underlying SAS, the IAS includes the phosphatic sands, clays, and carbonate rock units of the Miocene-age Hawthorn Group. In addition to containing water-bearing layers capable of supplying adequate quantities of water for domestic supply and other uses, the approximately 400-foot-thick IAS serves as the confining unit for the underlying FAS. The FAS, a confined aquifer system that includes hundreds of feet of highly permeable Eocene-age carbonate rock units, is the primary drinking water source for Duval County and the northeast Florida region.

Data Sources and Raster Dataset Creation
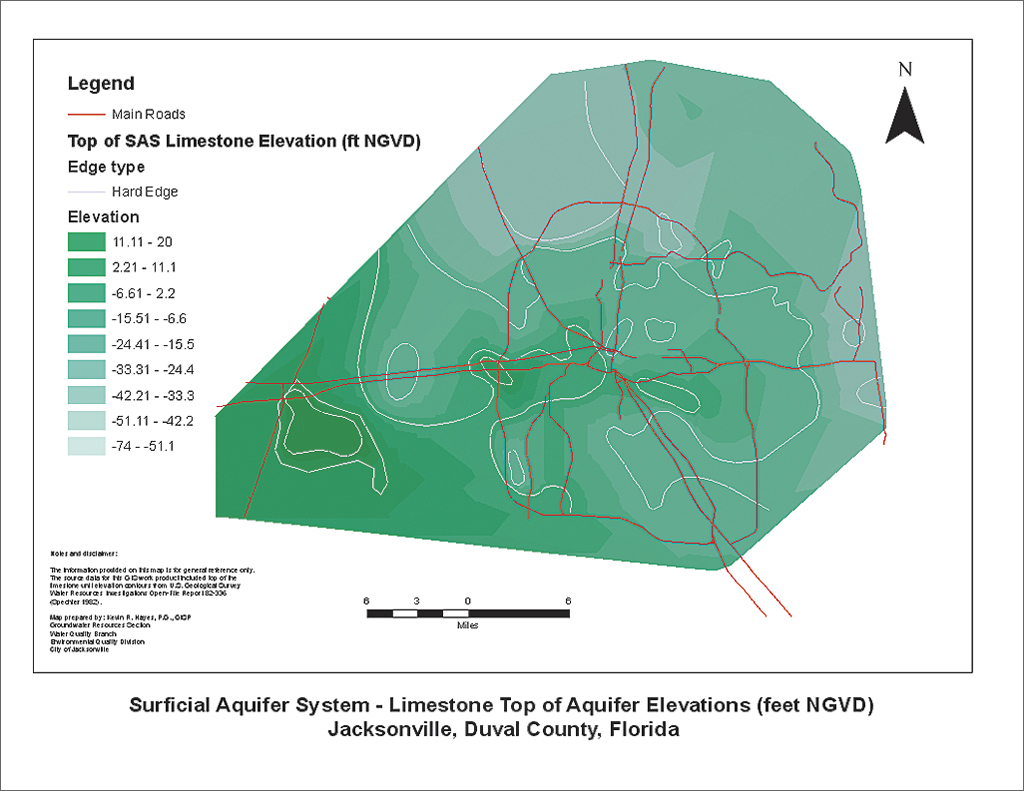
The 1982 USGS Open File Report 82-336 provided elevation contours referenced to National Geodetic Vertical Datum (NGVD) for the top of the SAS limestone aquifer. To create a depth to aquifer from ground surface dataset, the top of the SAS limestone elevation data was subtracted from the lidar-based, ground surface elevation data. Raster files for both elevation datasets were created in ArcGIS using ArcToolbox. Calculations were completed using the Spatial Analyst extension toolbox.
Creating the Depth to Aquifer Raster Dataset
The following steps summarize the process followed for the project.
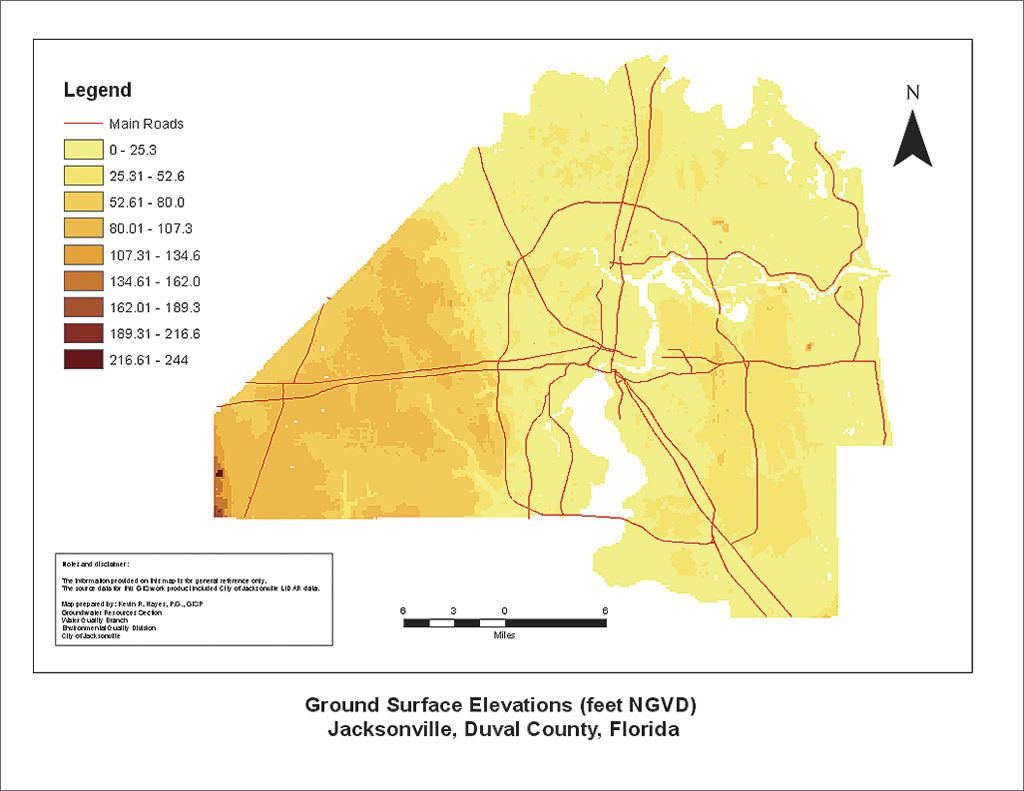
Initially, the county-wide, two-foot contour interval topographic elevation feature class was converted to a raster dataset using a tool from the Conversion toolset in ArcToolbox. The raster topographic elevation dataset, which ranges from sea level to over 200 feet NGVD, was created using the Polyline To Raster tool.
To create a raster dataset for the top aquifer elevation data, an 8.5 x 11-inch hard-copy USGS Open File Report map was scanned and saved as a .tif file. The scanned map did not include the individual well data points, so the contours were used to extrapolate the elevation data. The scanned .tif file was added to an ArcMap document created for the project. This MXD included the Duval County road network and other basemap features. Using the Georeferencing toolbar, the scanned .tif (a raster) was referenced to the road network on the underlying basemap using control points. Finally, the raster was transformed using the rectify command.
The scanned, georeferenced/rectified top of aquifer contour map was then ready to provide a guide for the creation of a file geodatabase feature class of the top of the SAS limestone elevation. Using the Editing toolbar and heads-up digitizing techniques, two feature class datasets were created using the georeferenced/rectified contour map: one representing the top of aquifer elevation contours and the other a polygon feature class denoting areas where the limestone aquifer is not present.
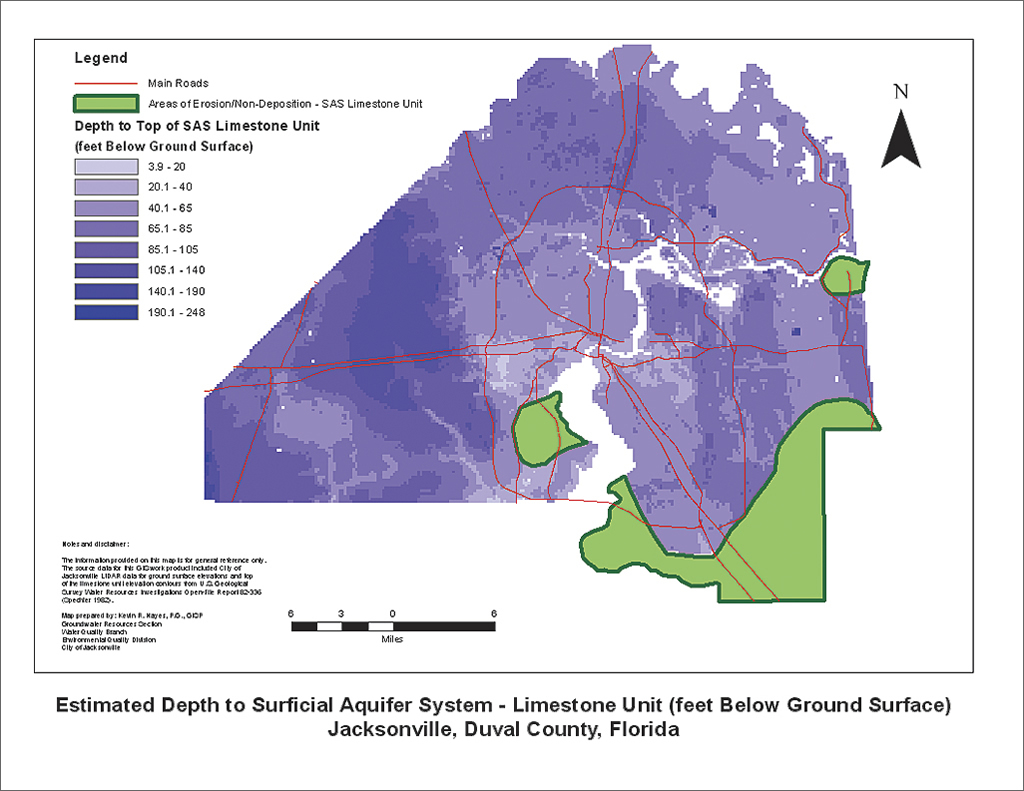
Again, using the Polyline To Raster tool, the top of aquifer elevation data was ultimately converted to raster format. With raster datasets created for both the ground surface/topographic elevations and the top of the SAS limestone aquifer elevations, the Minus tool (Spatial Analyst toolbox > Math toolset > Trigonometric tools) was then used to calculate the depth from ground surface to the top of the aquifer.

The depths in the raster dataset range from less than 10 feet below ground surface (BGS) in limited areas of the county to depths of greater than 200 feet BGS in the extreme western portion of the study area. The SAS limestone aquifer is not present beneath the southeastern portion of Duval County and in isolated areas to the south and west of the St. Johns River, which runs through the area.
The depth to aquifer raster dataset and the areas of erosion/nondeposition for the SAS limestone feature class were stored in a file geodatabase format and added to the EQD Groundwater Contamination Risk Management GIS MXD for use by EQD staff. The depth to aquifer information is helpful in determining approximate well depths required to access the SAS limestone aquifer in specific areas of the county as well as determining the producing aquifer for wells based on reported depth and other well construction information.
Project Benefits and Future Plans
Incorporating the aquifer information into ArcGIS has allowed quicker access to the data and given EQD staff the ability to provide more accurate subsurface information to property owners, drilling contractors, environmental consultants, government agencies, and other interested parties.
Based on the highly permeable nature of the SAS limestone, the depth to aquifer data generated in this GIS project may provide insight into the potential vulnerability of the shallow aquifer to contamination. The proximity of the SAS limestone aquifer to the ground surface will likely have significant implications for subsurface contaminant migration within Duval County. Further evaluation of this issue is ongoing.
In the next phase of this GIS project, USGS data points from the 1982 Open File Report into ArcGIS will be incorporated. In addition, depth-to-aquifer data provided in Well Completion Reports submitted to EQD, site assessment reports prepared by environmental consultants, and other available hydrogeologic reports will also be included. Additional depth-to-aquifer data will further improve the accuracy of the products generated. Similar GIS project efforts for the IAS and FAS are also planned.
For more information, contact Kevin R. Hayes at the City of Jacksonville, Florida Environmental Quality Division.

