It’s no secret that geography is a key factor in all things related to planning and community development. Sometimes it’s an influencing factor. Sometimes it’s the main driver for a project and the reason why the public embraces or opposes it.
GIS is the tool that helps us measure, analyze, and visualize geography. For most of its early years, GIS was out of the reach of many planning professionals because it required expensive hardware, client-side software, and usually multiple weeks of training. It was an investment many planners couldn’t make, particularly if they had access to a GIS professional in their organization. But when you have people who aren’t subject matter experts in planning involved in planning-focused analysis, it’s very easy for information to get lost in translation.
The emergence of web-based GIS has evolved the role of planners so that they can efficiently access and utilize tools to make better, more sustainable, data-driven decisions. Simultaneously, this frees up GIS staff to work on other crucial projects. A modern geographic approach helps planners understand neighborhood characteristics, derive business intelligence, generate sustainable policies, support civic inclusion, and design sustainable scenarios.

Understanding Neighborhood Characteristics
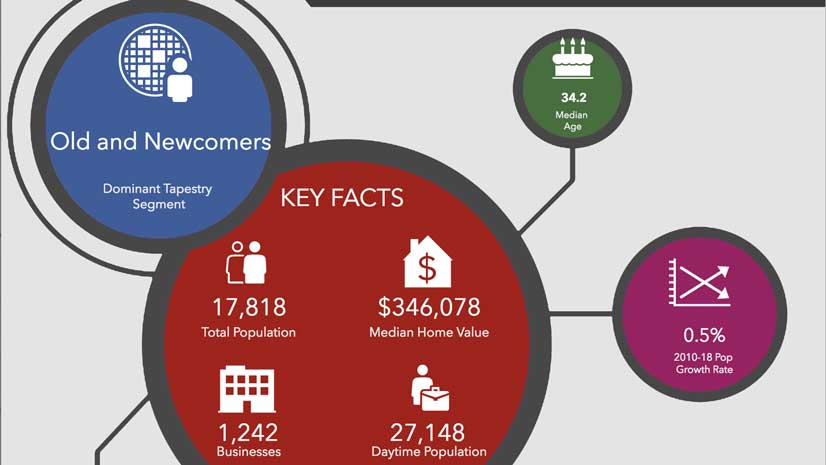
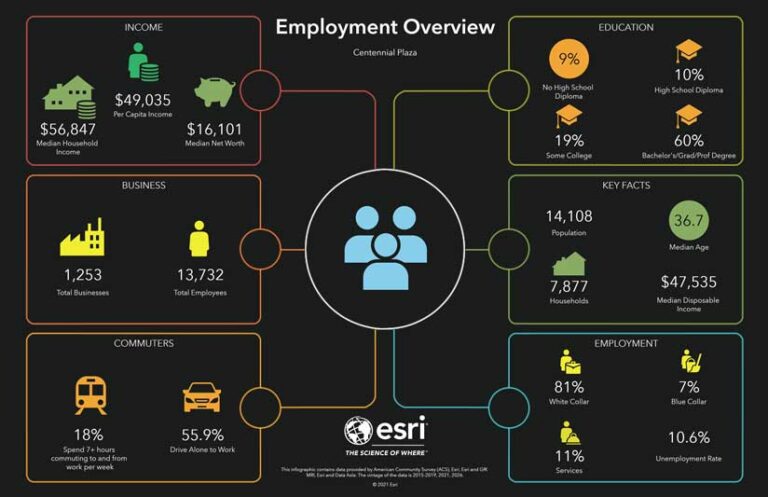
“A map is a pattern made understandable, and understanding precedes action,” is an often-repeated quote of Richard Saul Wurman, founder of the TED conferences. GIS helps us understand the demographics, socioeconomic characteristics, housing situation, and other aspects of individual neighborhoods. Instead of relying on anecdotal or dated information, GIS provides access to thousands of authoritative variables to generate a clear picture of the aspects, resources, and needs of a community.
Within the Esri platform, this is accomplished using ArcGIS Business Analyst Web App. This web-based approach provides an easy way to not only view and analyze data, but also collaborate with colleagues, property developers, elected officials, and the public, so that everyone is working off the same authoritative content.
Two of the app’s outputs are infographics (both template based and customized) and reports. These provide valuable complements to maps that help drive decisions such as locating businesses, identifying community needs, understanding the local workforce, and accessing consumer spending behavior.
Deriving Business Intelligence
The permitting system is almost always the system of record in a planning department. Although data entry and analysis are usually done by a relatively small group within the organization, planners, administrators, and elected officials need to derive business intelligence from the data gathered by the permitting system. This can be challenging with a legacy system, a not uncommon situation given the cost of permitting systems.
Within the Esri platform, this business intelligence can be derived by using ArcGIS Insights, a web-based app. With simple outputs from the permitting system, ArcGIS Insights can be used to answer questions such as:
- How do the number of permits this month or this year compare to those from last month, last year, or five years ago?
- Where is the most activity occurring? How do developments in one council district compare to those of a neighboring district?
- Which neighborhoods and types of permits have received the most stop work orders?
In the end, this kind of business intelligence helps efficiently generate additional value from the permitting system for a city that has probably already invested hundreds of thousands of dollars in it over the years.
Generating Sustainable Policies
Increasingly, the role of planners has moved from simply reviewing site plans and subdivision plats to influencing policy development for cities and counties. That influence can be found in comprehensive plans, housing policies, or economic development (which are all usually intertwined). As with understanding neighborhood characteristics, policy development works best with a data-driven approach. Esri Maps for Public Policy (livingatlas.arcgis.com/policy/overview/) is a free resource dedicated to raising the level of spatial and data literacy used in creating public policy that addresses topics from economic opportunity and social equity to transportation and infrastructure and public safety. The site provides curated maps that can help generate more sustainable and more justifiable policies. This content can exist on its own and can be simply viewed in a browser or collected and added to another app within the ArcGIS environment.
Supporting Civic Inclusion
Virtually everyone cares about the neighborhood in which they live. In the past, when residents wanted to voice their concerns, a public planning commission hearing or an even more infrequent town hall meeting was their only option. However, just because someone couldn’t show up for a planning commission meeting on a Tuesday evening didn’t mean they didn’t care about the community.
Today, cities and counties must be more inclusive. They must find new ways for the public to engage with—and be engaged by—their government. Location is at the heart of most planning activities, so GIS remains a key component in civic inclusion. ArcGIS Hub provides a focused, initiative-driven approach to providing open data, delivering information, and receiving feedback. That feedback can be a survey, freeform comment, or map markup showing the location of a proposed park. This approach to civic inclusion is less about simple notification and more about developing a genuine partnership between the government and the public.
Designing Sustainable Scenarios
With an understanding of neighborhood characteristics, policy development, and civic inclusion in place, planners can more effectively design the types of plans and projects that meet the needs of the community. This can be done collaboratively with developers or proactively by demonstrating how a community’s needs can be met with a specific design or land-use plan.
ArcGIS Urban provides the 3D and 2D web-based tools that planners can use to develop multiple scenarios quickly and efficiently. They can view and measure the impact of scenarios on population, jobs, utilities, traffic, tax revenue, and other aspects. Administrators, developers, and the public can review these scenarios.
In many cities, zoning reform is being demanded to meet a city’s modern housing needs. Without spending tens of thousands of dollars on consultants, ArcGIS Urban allows planners to play out and compare different zoning scenarios to show how many people and jobs could be accommodated with a new proposed zoning classification. It’s an effective way to streamline changes in dated codes that stifle the growth and development of neighborhoods.
Because ArcGIS Urban is part of the ArcGIS system, 3D web scenes created when planning scenarios can be shared with others and integrated into ArcGIS CityEngine to provide a photo-realistic view of a proposed development.
GIS is no longer a luxury for planning departments. It’s a mission-critical system. It provides apps and tools that are more accessible to planning professionals. The geographic approach enabled by GIS empowers data-driven decision-making, policy development, and design that meets the needs of modern communities.