Ninety percent of all information we remember is based on its visual impact, according to a Forbes magazine article entitled “Use Infographics to Boost Your Credibility and Traffic.”
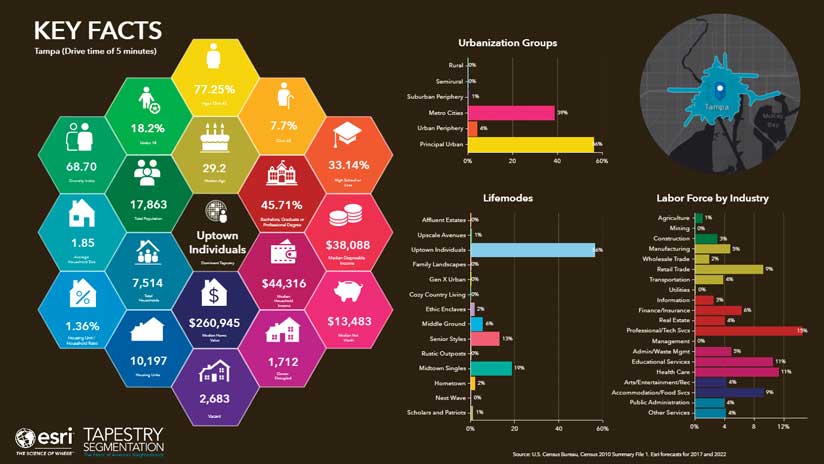
Infographics summarize key facts in a way that is easily digested by the reader and turn hundreds of words into easily understood facts. ArcGIS Community Analyst provides a growing library of professional infographics and templates that improve the way you tell the story of your community.
Although many municipalities still use paper brochures and static websites to attract investment, interactive infographics provide a beautiful, engaging, and easy-to-update user experience that the businesses you want to attract will want to use. Any infographic can be exported as an image or PDF, included in an Esri Story Maps app, or embedded in a community’s website as an interactive dashboard.
Economic developers are continually challenged with finding the best strategies for successfully attracting new business—while growing existing business—to make their region a better place to live, work, and play. By employing entrepreneurial strategies that produce jobs for local citizens and increase tax revenues, they create opportunities to improve the community. A data-driven approach to attracting, growing, and retaining quality businesses is essential to realizing those goals.
Community Analyst provides the tools that help you employ three strategies for ensuring economic development success: showing off your community’s strengths; bringing your data together; and simplifying communication, both internal and external.
Show Off Your Strengths
All communities have strengths and weaknesses, so it is vital that you understand those of your community. The most successful economic developers emphasize the strengths that differentiate their community from neighboring ones. Those strengths could be an educated and diverse workforce, affordable housing, lower cost of living, or a thriving local economy.
Presentations made by the last 20 communities competing to be chosen for Amazon’s new headquarters relied on data and infographics produced by Community Analyst. Easily embedded in Esri Story Maps apps and community websites, infographics provide a mechanism for easily sharing valuable insight with stakeholders in a way that sets you apart from the competition.
Bring All Your Data Together
Community Analyst shortens your market analysis process. The infographics created using it effectively summarize large amounts of data. Infographics help improve the site-selection process and the flow of information from the local government to the stakeholders and entrepreneurs who can best use these visualizations to drive job growth. Employment-centric infographics get the buy-in of start-ups or existing businesses that are looking to locate a new facility. The hyperlocal information presented in infographics helps them choose your region.
A large percentage of new jobs in an economy are created by existing companies. One major role of an economic developer is to reduce a region’s overreliance on a single industry sector by improving the diversity of the whole local economy. Community Analyst helps an economic developer support companies that are expanding operations to stay local rather than relocate elsewhere.
Jobs and employment data help a community understand the industries that are best placed to grow and how well local skills and wages match this growth potential. Developing a more detailed understanding of businesses that exist within the community helps deliver services that retain and grow business locally. Growing local businesses tends to encourage wage earners to spend locally. For example, job growth in a manufacturing business will drive the need for other service industries such as retail and health care. Creating new jobs in existing industries has a multiplying effect on unrelated industries and generates new sources of tax revenue because the economic base is diversified.
Better infrastructure and more jobs improve the economy of the region, raising the standard of living for all residents. This creates a virtuous cycle: as the quality of life improves in your community, which becomes more attractive to external organizations as a result, so the growth potential for local companies increases.
Simplify Internal and External Communication
Data, infographics, reports, and story maps generated using Esri technology improve the way you communicate with existing businesses—usually a community’s greatest resource for attracting new jobs and investment. By understanding the needs of businesses and the demographic and socioeconomic trends in your community, you can improve your community’s services before other communities can compete for the same jobs. Existing businesses are often your best ally when advocating for your community. Better understanding and communication with them can dramatically increase your chances for job growth and community improvement.
What’s Next?
Economic developers want to provide their communities with more and better jobs by attracting companies that will create jobs that are appealing to both current residents and new graduates, and even entice companies that have left the region to return. New investments and the increased presence of existing companies enable the community to thrive. Greater economic prosperity and the growth of tax revenue enable a community to reinvest in local infrastructure such as schools, transit, and parks.
Through understanding the needs of business and the strengths of your community, you can create an environment in which opportunities abound. Workers will move into the area in search of their dream jobs. With the ability to easily discover and communicate your community’s differentiating characteristics in comparison to nearby, competing jurisdictions, you will help your community reach its economic potential.


