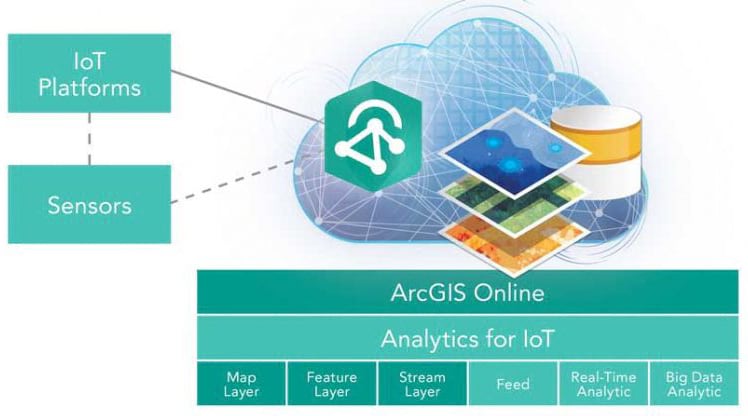
The massive amounts of real-time sensor data collected by organizations has the potential for creating smarter systems, but organizations need to make sense of it. ArcGIS Analytics for IoT, a new, real-time, big data processing and analysis capability of ArcGIS Online, can help organizations use this data to gain spatial insight and awareness. It works at scale in the Esri Geospatial Cloud to process streaming and historical observations from Internet of Things (IoT) devices. It requires no deployment or maintenance.
Analytics for IoT can ingest, visualize, analyze, and act on data from IoT sensors. The modern, streamlined user experience enables users to effortlessly tap into sources of observation data and make it available to anyone in an organization. GIS analysts, operations officers, and data scientists can analyze streams of real-time sensor readings or existing historical data.
- The diverse set of data connectors and analytic tools in Analytics for IoT supports workflows for industries ranging from city agencies and electric utilities to commercial companies and nongovernmental organizations. Analytics for IoT capabilities can
- Connect to IoT systems to visualize sensor observations.
- Geofence areas of interest to detect the spatial proximity of events.
- Process high-velocity and high-volume data.
- Enrich and filter observations to focus on the most interesting event data.
- Provide data management as a service when data has grown in real time.
- Cut through the noise in the data and identify important incidents and trends.
- Apply spatial statistical analysis and machine learning tools to large datasets.
- Provide a cloud solution for real-time and big data workflow.
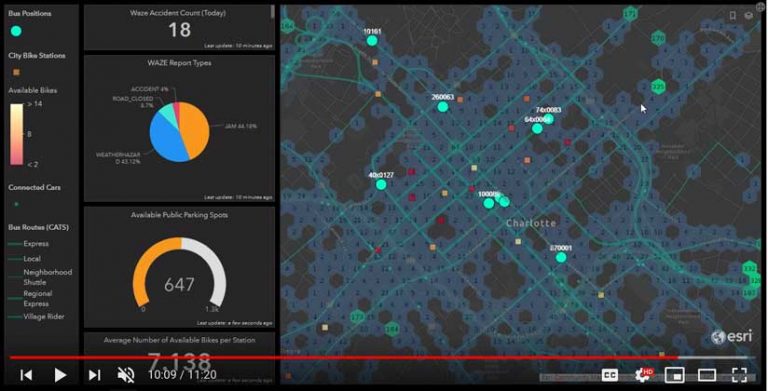
With Analytics for IoT, users can configure feeds and ingest streaming data to immediately visualize real-time information in web maps and dashboards. Real-time data can be brought in over HTTP and from cloud platforms such as Microsoft Azure IoT and Amazon Web Services (AWS) IoT or consumed from industry-standard messaging technologies like Apache Kafka, MQTT, and RabbitMQ. Analytics for IoT also works with IoT observations that have already been collected, such as data in ArcGIS feature layers or in external big data sources like Amazon Simple Storage Service (Amazon S3) and Azure Blob Storage.
Beyond data visualization, Analytics for IoT can filter, process, and use high-velocity event data to trigger action. Users can leverage virtually any kind of streaming data and automatically alert personnel when specified conditions occur. For example, an electric utility operations officer can construct a process to receive readings regularly from smart meters. When those readings indicate a power outage, Analytics for IoT can automatically notify the field crew closest to the affected area.
The real-time analysis tools in ArcGIS Analytics for IoT include fundamental and powerful spatial operators for
- Analyzing patterns.
- Finding locations.
- Managing data.
- Summarizing data.
- Using proximity.
- Data enrichment.
These tools can easily be combined to mine incoming information that’s relevant to the mission at hand. Whether performing geofencing, detecting incidents, identifying trends, or finding areas of data clustering, Analytics for IoT has myriad ways to uncover hidden meanings in incoming data.
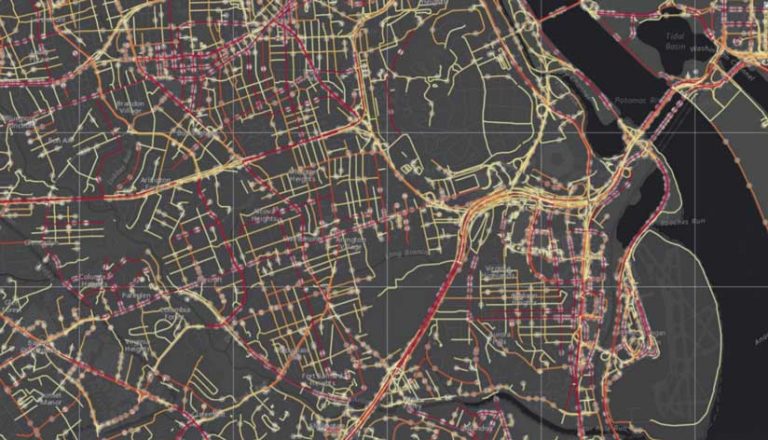
While Analytics for IoT is well suited for workflows that deal with observations received from IoT devices and sensors, users can also employ it to work with nearly any source of real-time or big data. For instance, users could design an analytic model to process high-volume historical crime data to assess patterns and trends or summarize human movement data in urban areas to better understand how workday population cycles ebb and flow. In addition, analysis results can be stored in ArcGIS so they can be shared with key stakeholders or further explored and evaluated on maps. Users can also deliver their results to external cloud stores, such as Amazon S3, for additional processing.
ArcGIS Analytics for IoT unlocks the power of location in the Internet of Things. With this capability, smart cities, federal agencies, utilities, oil and gas companies, retailers, and many other organizations can start taking advantage of the IoT in innovative ways and gain real-time visibility into day-to-day operations. This increased situational awareness supports data-driven decision-making at both the right time and the right place.