At any given time, more than 50,000 ships are at sea or in port throughout the world. These include military ships, cargo ships, tankers, and commercial fishing vessels. While most are engaged in declared (and legal) activities, monitoring ship movements is a critical part of United States’ frontline defense from potential threats to national security.
Key to this monitoring process is the collection and analysis of satellite imagery to produce geospatial intelligence (GEOINT). The National Geospatial-Intelligence Agency (NGA) is the primary source of GEOINT for the United States Department of Defense (DoD) and the 16 other US intelligence community agencies.
Analyzing and disseminating GEOINT is complex. NGA embeds analysts at US military, diplomatic, and allied locations around the world, including DoD combatant commands such as the United States Southern Command (USSOUTHCOM).
USSOUTHCOM is responsible for the landmass of Latin America, south of Mexico; the waters adjacent to Central and South America; the Caribbean Sea; the Gulf of Mexico; and a portion of the Atlantic Ocean. Its duties include operations, contingency planning, and security cooperation.
Automating the Image Analysis Process
In 2018, NGA set a mission goal to enhance the speed at which it provides insight to its partners, the precision of its assessments, and the scope of its mission through artificial intelligence, automation, and augmentation (AAA). To achieve this goal, USSOUTHCOM and NGA developed the Port Imaging Ship Change Exploitation Service (PISCES), which monitors port activities in about 20 countries, 60 port facilities, and over 150 geofenced areas of interest within these ports.
“This is a machine learning initiative that is fundamental to the command’s port monitoring and pattern of life understanding efforts and falls in line with the broader AAA initiative as a computational system,” said Michael Kurey, an NGA senior geospatial analyst at USSOUTHCOM.
PISCES was developed to overcome the constraints of limited resources and personnel. “The output is augmenting human intelligence by taking advantage of automation to achieve more efficient and accurate results than otherwise possible due to resource constraints and ever-increasing availability of data,” said Kurey.
“USSOUTHCOM focuses on building relationships with the other countries within our AOR [area of responsibility]. The GEOINT we produce is used for monitoring rather than combat purposes,” said Patrick Oakes, an NGA senior GEOINT analyst at USSOUTHCOM.
Imagery analysts were performing time-consuming visual interpretations of satellite imagery while continually getting new requests for analyses. An automated solution was needed to streamline and prioritize analysts’ daily workflows as well as develop deeper insights. PISCES was designed to free up analysts to focus on higher-priority issues in the AOR while not relinquishing their duty to monitor facilities.
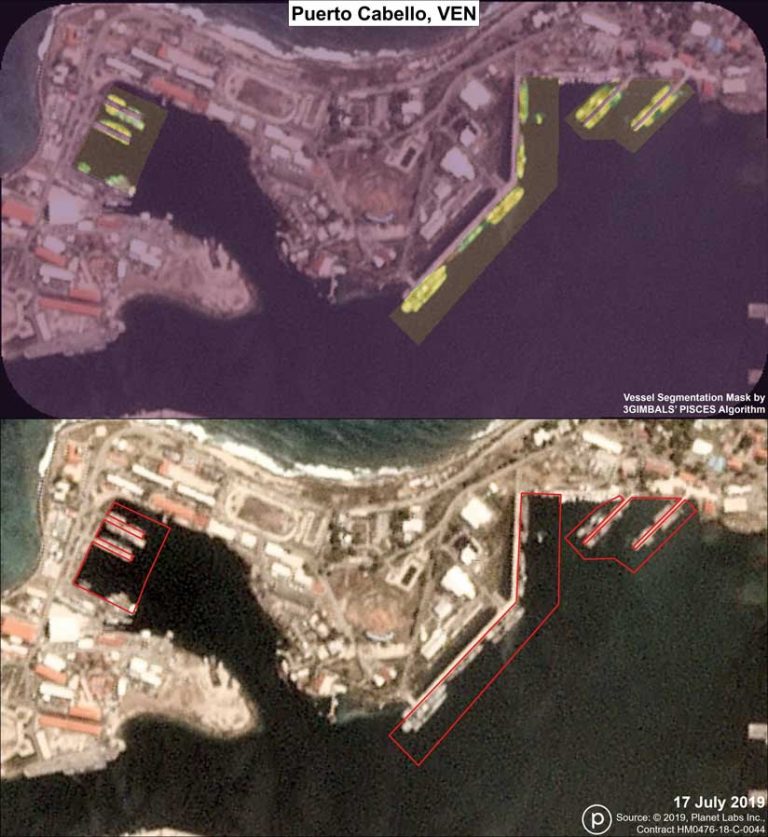
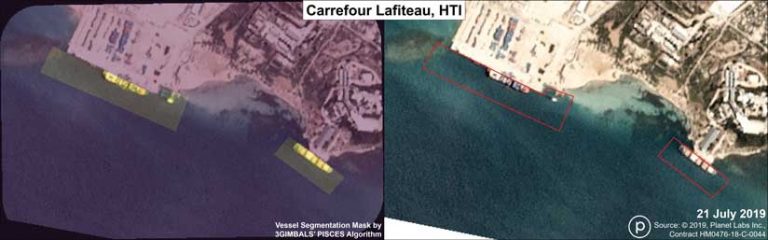
To accomplish this, PISCES first needed to automatically segment vessels in imagery using a computer vision algorithm. In late 2016, the first proof of concept was attempted by the USSOUTHCOM Planet Power User Working Group using features designed to categorize a given pixel as water or not water, based on its spectral properties across the red, green, and blue (RGB) image bands. This provided evidence that medium-resolution imagery might be useful in monitoring maritime port activity.
Based on the positive result of this experiment, engineers on the 3GIMBALS COGINTTM team at USSOUTHCOM created a robust machine learning computer vision algorithm that could make assessments involving varying water spectral properties, image quality, cloud cover shadows, and other factors. To do so, the engineers trained a neural network using annotated images. The resultant model was very effective at segmenting vessels under varying conditions.
“Our application takes advantage of high-temporal cadence imagery,” said Oakes. Medium-resolution imagery of the same geographic area is processed on a nearly daily basis in the PISCES model. That imagery is obtained from Planet, a US-based company that maintains the world’s largest constellation of earth imaging satellites, which scan the earth’s entire landmass each day.
Planet’s Dove constellation is used to support the PISCES model. Dove CubeSats, designed and built in-house in San Francisco, California, collect orthorectified imagery in four spectral bands (red, green, blue, and near-infrared) at 3- to 5-meter resolution.
The PISCES Workflow
USSOUTHCOM’S PISCES initiative began with a port listing obtained from the United States Transportation Command (USTRANSCOM), which is responsible for monitoring all waterways and ports worldwide.
Once a port is determined to be of interest, imagery analysts create geofences around specified AORs. These geofences are saved in GeoJSON, an open standard geospatial data interchange format, and ingested into the PISCES model for use in ship segmentation.
ArcGIS Enterprise connects directly to the PISCES database to pull the resultant algorithm predictions. As the algorithm runs, its results are automatically discovered by ArcGIS GeoEvent Server and appended to the feature class. This information is visualized in Operations Dashboard for ArcGIS using ArcGIS Arcade (an expression language) to render symbols using clustering that summarizes information for an AOR at different zoom levels. Dashboards let analysts summarize the entire AOR at both spatial and temporal scales and perform aggregation across both to quickly see summaries of anomalous activity in graphic form. Because the dashboard is on demand and self-service, it is an improvement over traditional weekly summary emails.
“This helps them develop meaningful insight from PISCES by visualizing events and performing trend analysis. A decision-maker can quickly visualize top-level summaries, and an analyst can drill down to discover additional details,” said Kurey.
USSOUTHCOM plans to utilize ArcGIS GeoEvent Server to append additional feature classes statistically summarizing aggregated assessments across time and space to render more powerful strategic stories. One idea for increasing PISCES capabilities would be to integrate its results with data from systems that automatically track ships. Vessels fitted with transponders broadcast identification, position, course, and speed. Integrating this data would enable the identification of specific vessels.
The Future of Machine Learning at USSOUTHCOM
In the future, USSOUTHCOM would like to adapt the feature segmentation algorithm framework and methodology developed for PISCES for both air and land domains. Rather than creating multiple individual dashboards, one comprehensive dashboard would include air, ground, and sea domains. All data would be stored in the same portal, and analysts could simply select an environment of interest.
“We believe our experiences with PISCES and the machine learning process would allow us to establish these new projects much faster. We would also like to make greater use of the results we obtain from PISCES by using the predictive analysis tools. This will allow us to better analyze ship movement trends in order to anticipate future events in our monitoring process,” concluded Oakes.
About the author