
An interdisciplinary group of researchers at Rochester Institute of Technology (RIT), drawn from GIS, material science, and engineering fields, used GIS in managing, determining, and visualizing data uncertainty as part of their analysis performed to fill a gap in renewable technology recovery policy.
RIT, located in Rochester, New York, is home to the new Golisano Institute for Sustainability building and several other Leadership in Energy and Environmental Design (LEED)-certified buildings that incorporate renewable technologies such as solar photovoltaics (PV). RIT has invested in this technology not only to mitigate climate change but also as part of a broader effort by New York State to meet its renewable portfolio standard that mandates the use of technologies like PV.
In addition to these mandates, state policies use financial incentives to further encourage renewable energy adoption. These programs are working, according to the United States Energy Information Administration. New York State has the fifth largest renewable energy capacity in the United States, despite its less than ideal climate.
One drawback of policies that expand renewable technology is they do not proactively consider how the waste produced by PV panels is managed once these panels reach the end of their life span. PV cells contain economically valuable materials, such as silver, indium, and gallium, and other materials, such as silicon and tellurium, that are extremely energy intensive to produce because they can require purities as high as 99.99999 percent. An additional concern with materials contained in PV cells is the potential for toxic metals, such as arsenic and cadmium, to leach into groundwater once these materials are in landfills.
For these reasons, discarded PV panel materials that become part of the waste stream must be recycled. However, it is uncertain whether New York State has the infrastructure to collect and sustainably recover these materials. For example, less than 15 percent of all material recovery facilities in the state can manage waste streams similar in composition to PV materials. Of these, only half of recovery facilities are located near existing PV installations. Therefore, the gap in renewable technology recovery policy represents a missed opportunity to divert potentially hazardous materials from landfills that cannot contain them and redirect economically viable materials to secondary materials markets.
Supporting Recycling Policy Making
An interdisciplinary group of researchers at RIT from GIS, material science, and engineering fields sought to address this policy gap by asking the following:
- How can we optimize infrastructure for collection and resource recovery?
- Does a centralized or a decentralized location-allocation strategy minimize cost?
- To what extent can existing infrastructure be used, or does it make sense to build new infrastructure?
Addressing these questions required compiling data on current recovery infrastructure and PV installations and then resolving data quality and quantity issues to build a decision model. Both activities proved to be challenging.
Data Collection
Recovery infrastructure data on transfer stations, landfills, and recycling facilities is managed by the New York State Department of Environmental Conservation (DEC). This data is publicly accessible but incomplete in terms of key parameters of organizational hierarchy, capacity, and cost information. In contrast, PV installation data points are available for 61 of New York State’s 62 counties from the New York State Energy Research and Development Authority (NYSERDA). The NYSERDA data is detailed in terms of capacity and cost but with limited spatial resolution (only city- and county-level geospatial data is publicly available).
In this context of uncertain data quantity and quality, sustainability researchers sought to model the current recovery infrastructure and evaluate the cost-effectiveness of operations for solar panel waste recovery. Due to the geographic nature of this problem, ArcGIS for Desktop was an essential tool in helping to manage, determine, and visualize data uncertainty.
Uncertainty Model Development
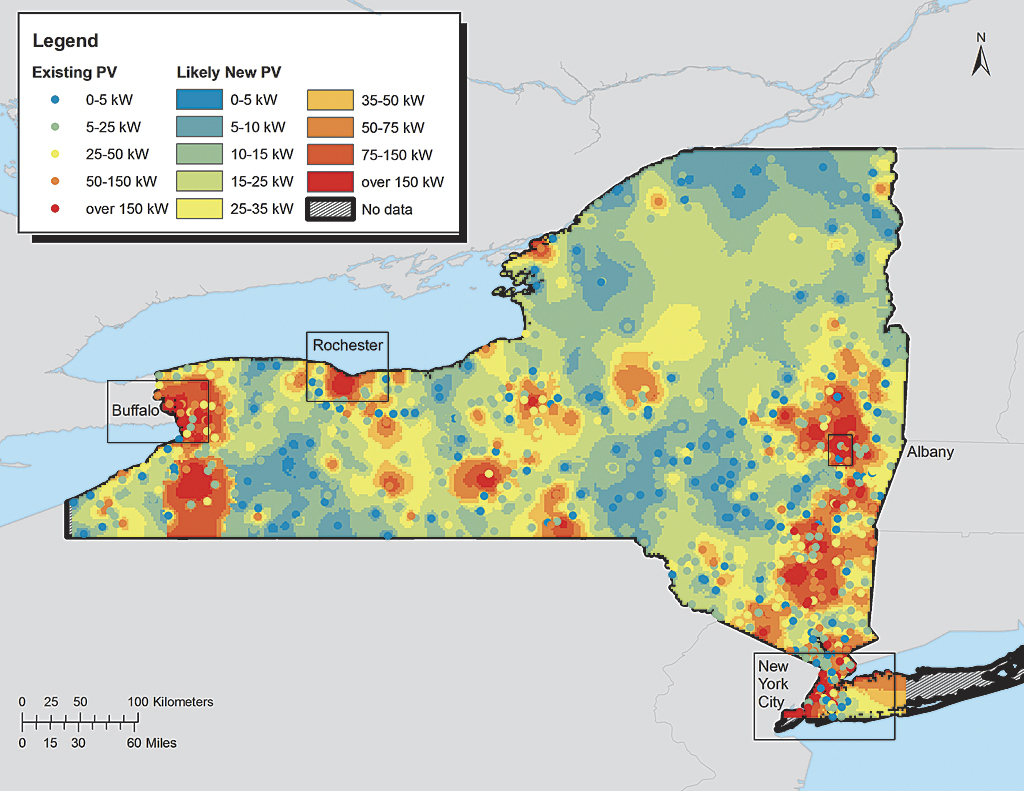
To address the first question of how to optimize infrastructure for solar PV recovery, a heat map of likely future PV installations was generated in ArcGIS 10.1 for Desktop using ArcMap and the Inverse Weighted Distance (IWD) tool available with the ArcGIS 3D Analyst or ArcGIS Spatial Analyst extension. A feature dataset of 840 current PV location points was used as input for this tool.
The IWD tool was chosen because PV growth is analogous in behavior to that of disease infection in that the number and the density of infected individuals in a population (or the existing PV locations in a particular area) determine the likelihood of additional cases (or additional PV facilities in that area). Despite the limited spatial resolution of the PV location points, the heat map showed interesting overall trends for likely future PV hot spots in Rochester, Buffalo, Albany, and New York City—areas that have younger populations that live in urban areas and have high incomes.
When compared to the current recovery infrastructure, the heat map revealed several challenges for the state of New York. For example, some existing and likely solar installations are located more than 25 miles from recovery facilities in upstate New York. From a waste collection perspective, a greater distance represents a decreased likelihood of recovery due to increased transportation costs.
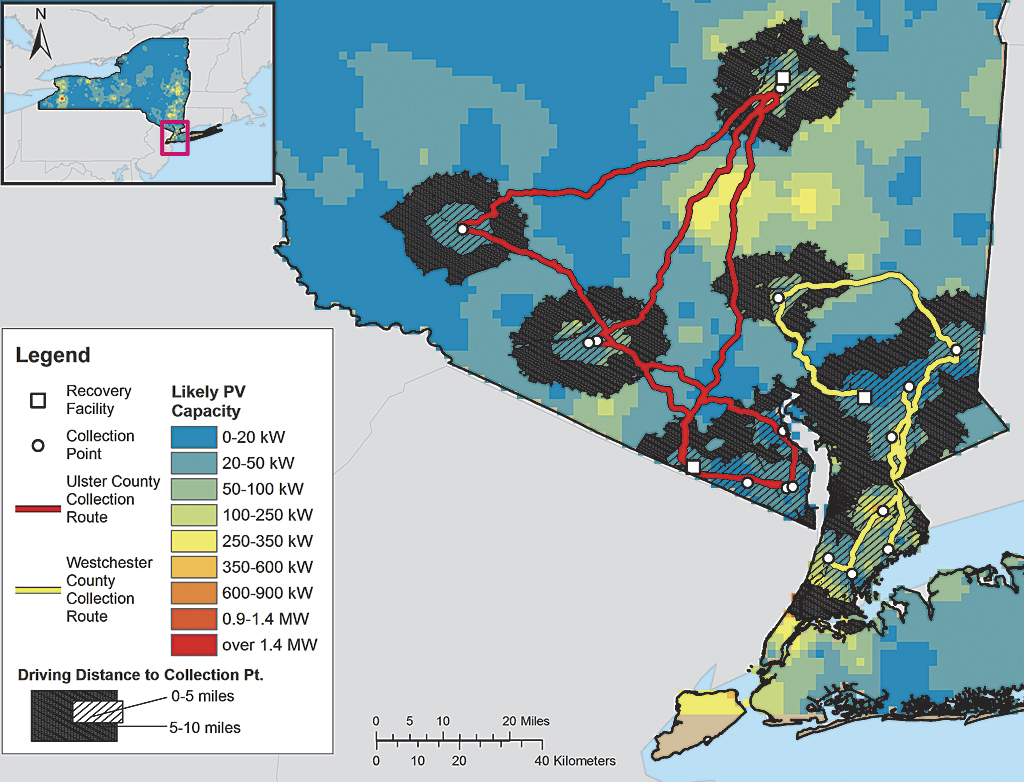
To address long-term planning concerns that include multiple future PV growth scenarios, a minimum cost evaluation of centralized and decentralized infrastructure strategies was the next step. An optimization model (coded in Python 2.7) was used with the objective function of minimizing cost and constrained by PV material volume, facility cost, capacity, and collection route distances. Solar PV installations were set as origins and recovery points as destinations using the OD Cost Matrix tool available from the ArcGIS Network Analystextension. Outputs were the collection route distance between each origin and destination point.
Several cost scenarios were tested to address the uncertainty in facility cost and capacity parameters. One strategy was to assume all facility costs, for example, capital, equipment, or labor, are equal for each individual facility. Another strategy was to characterize the best and worst cases based on the combination of processing steps, technologies, and resultant efficiencies. A third example was to develop a ranking system based on proximity to relevant infrastructure (in this case, preexisting landfills or material recovery facilities).
The model revealed the trade-offs between cost and collection. As the number of recovery sites increases, the collection rate and infrastructure costs increase, while the average collection route distance decreases. At this point, the analysis only took advantage of existing infrastructure. The question of whether infrastructure cost and collection could be improved by selecting different recovery sites still remained.
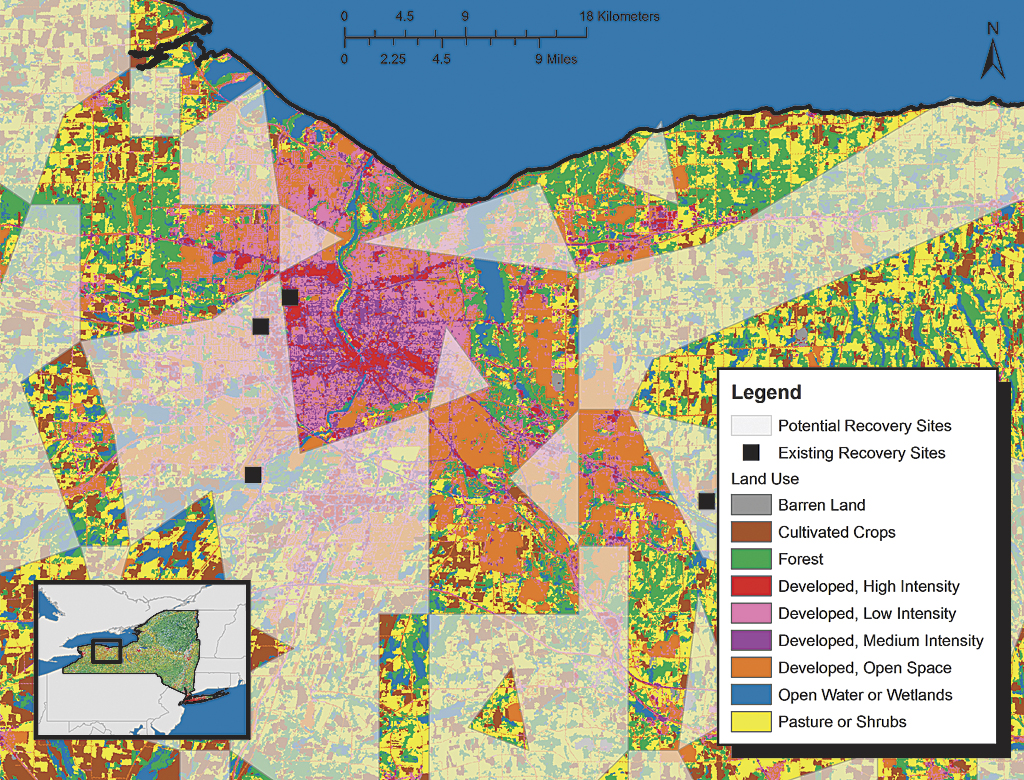
To address this question, a site selection model was developed using ModelBuilder in ArcGIS for Desktop that generated polygon features based on multiple criteria such as land-use, elevation, population demographics, and distance from communities vulnerable to toxic material leaching or air pollution such as wetlands and elementary and high schools.
New potential recovery facility points were generated from the polygon features using the Feature To Point tool in the Data Management toolset. The OD Cost Matrix tool then generated collection routes for the new potential recovery facility points to current and potential PV locations to help determine which facilities will be part of a minimum cost system of solar panel recovery.
For site selection, managing uncertainty consisted of varying criteria weights and values in the Weighted Overlay tool in the Spatial Analyst toolset to understand the relative impact on model output. For example, having a greater weighting for land use while restricting the use of forest and cropland produced the most limited solution space. In contrast, prioritizing the proximity of demand to landfills produced the largest area of potential new sites.
Conclusions
This work resulted in RIT policy and infrastructure recommendations for New York State policy makers that will enable the state to prepare for a looming volume of potentially valuable and/or toxic materials generated from solar panel disposal. To build on this work, RIT plans to apply these methodologies to solve other complex geographic problems such as investigating the sensitivity of location-allocation decisions to new demand information and resource availability constraints.
Summary
Infrastructure planning requires the meaningful organization of variables, data, and uncertainty assessment to understand the behavior of a system and the impact of assumptions on system outputs. In this case, for the study of waste recovery infrastructure design for PV panels in New York State, numerical and nonnumerical methods were used to evaluate the influence of uncertain variables on future demand, collection routes, and new facility site selection. This is an example of how ArcGIS for Desktop can serve as an essential tool for managing, determining, and visualizing data uncertainty. For more information, contact Gabrielle Gaustad.
Acknowledgments
This article is based on work supported by the National Science Foundation under Award No. CBET-1133422.
About the authors

Michele Goe

Brian Tomaszewski