The National Cave and Karst Research Institute (NCKRI) used hydrogeology, biology, and GIS to safeguard endangered species living below the surface. NCKRI is dedicated to promoting sustainable management
of caves.
How do you map a primarily unknown and poorly defined terrain? Mapping the distribution of rare and endangered species hidden in caves was the challenge presented to NCKRI. The US Fish and Wildlife Service (USFWS) contracted NCKRI to redefine the distribution of federally listed, endangered karst invertebrate species in the Austin, Texas, region. The resultant maps would help USFWS prevent the degradation and destruction of interconnected underground ecosystems that are unseen from the surface.
Because the underground landscape is mostly inaccessible to humans, NCKRI proposed a GIS model to predict likely species distributions and possible restrictions and barriers to their distribution. NCKRI selected ArcGIS Pro for modeling. The ArcGIS Spatial Analyst extension provides advanced modeling and statistical tools that allow users to perform comprehensive, raster-based spatial analysis to solve complex problems.
Models of species ranges identify the probability of encountering the subject species. As a result, GIS provides USFWS with valuable information for various regulatory needs such as managing and setting recovery standards. In addition, range maps help guide development away from sensitive areas, allowing opportunities to purchase or enhance the regulation of those areas.
Previous studies of the Austin karst species used simple and broad statistical methods to define their distribution. (Karst refers to landscapes usually characterized by caves and other cavities.) However, as new localities and additional information for the species became available, the earlier maps became out-of-date. Therefore, in 2021, NCKRI performed a more robust statistical analysis of species distribution in ArcGIS Pro. This study updated the karst fauna region (KFR) and karst zone predictive area boundaries established initially by the USFWS nearly 30 years ago and updated in 2007. (KFRs are regions with the same group of karst species.) [Karst zone areas are delineated based on the presence or probable presence of endangered karst species. They are defined as: Zone 1—areas known to contain endangered cave fauna; Zone 2—areas having a high probability of suitable habitat for endangered or other endemic invertebrate cave fauna (refined now to only endangered cave fauna); Zone 3—areas that probably do not contain endangered cave fauna; and Zone 4—areas which do not contain endangered cave fauna.]
How can GIS be applied to mostly hidden underground ecosystems? It comes down to knowing the nature of the geospatial data and using appropriate modeling constraints. NCKRI attempted multiple methods to identify the most accurate means of evaluating species distribution. Geology, hydrology, climate, vegetation, and soils are potential factors affecting species distribution. However, NCKRI did not incorporate all these methods and elements due to a lack of data with sufficiently high resolution.
Following an extensive evaluation, NCKRI determined the best modeling method was to reverse the GIS analysis. Rather than model the effects of various physical conditions on the species’ distribution, NCKRI analyzed the distribution range of each species.
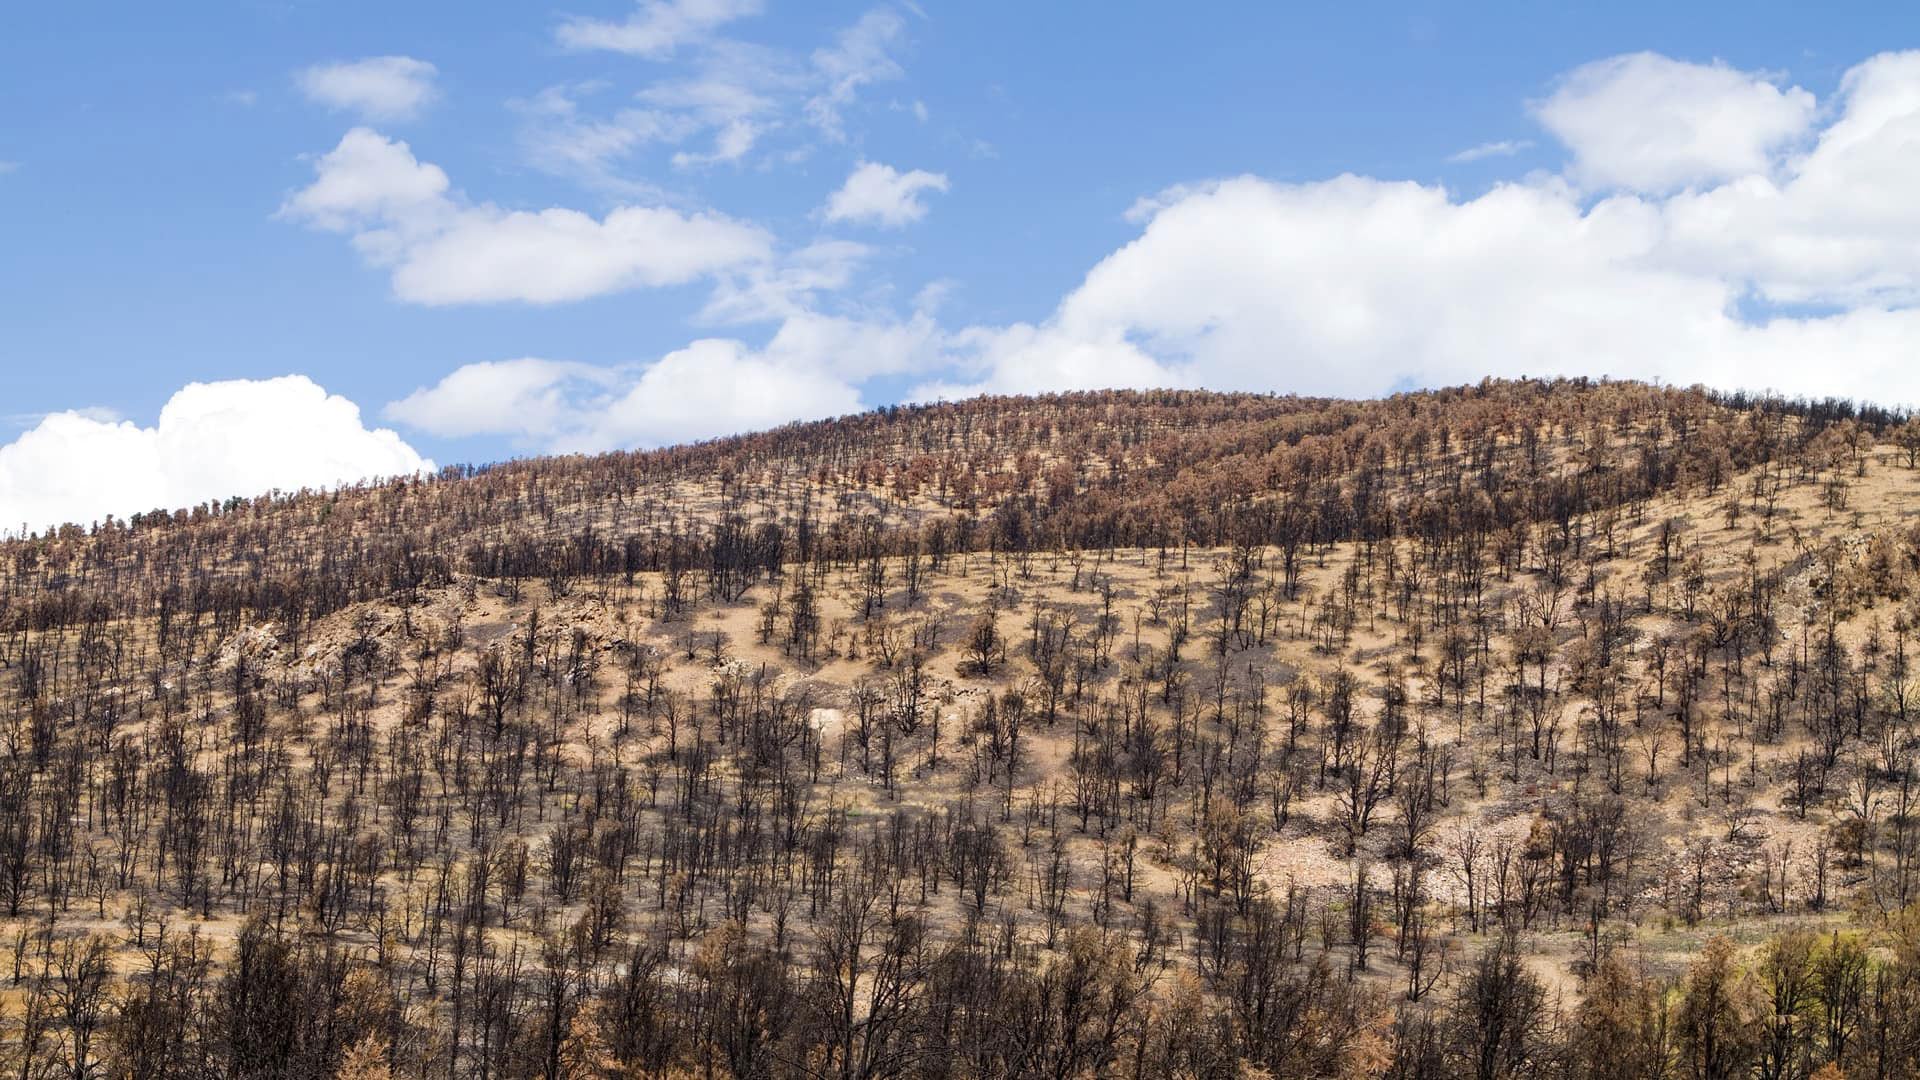
The investigation used hydrogeologic and biological data to create a GIS model that mapped the ranges of the 7 listed species and 32 nonendangered species from 479 caves in the study area. The 39 species used in the study—which included beetles, harvestmen, millipedes, pseudoscorpions, and spiders—were all fully adapted to their dark surroundings and do not occur on the surface. In addition, the 32 nonendangered but endemic species occupy the same ecological niches as the endangered species. Therefore, NCKRI used the additional information and layers of other potentially relevant data to constrain the distribution of the endangered species.
The clustering of multiple modeled species range margins within a limited area reflects the possible presence of a barrier or restriction to species distributions. NCKRI then carefully examined geologic factors, such as formation contacts, faults, streams, soils, and other factors, to determine if they create a barrier or restriction of the species’ distribution. In some instances, NCKRI found no hydrogeological explanation for a cluster of range margins and assumed that subsurface ecological conditions beyond the investigation’s scope created the restrictions or barriers.
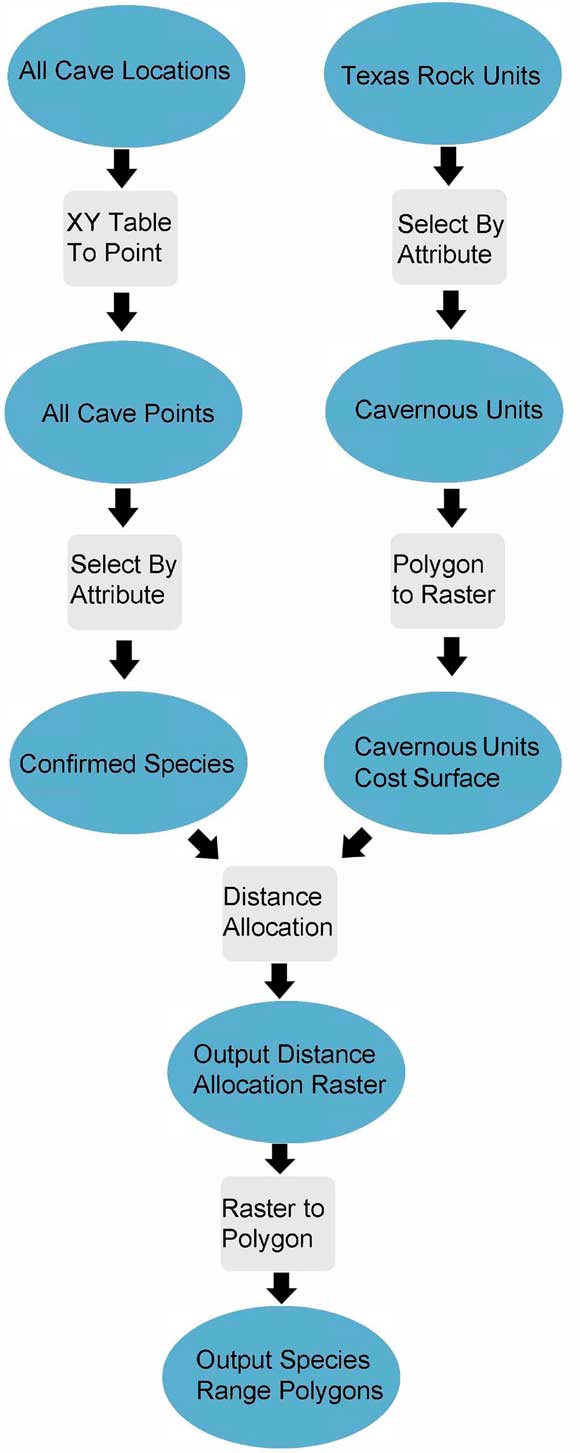
After evaluating the newly available geospatial tools and biological data in ArcGIS Pro, NCKRI initiated a series of five repeatable steps to perform statistical analysis to revise endangered karst species distributions along the Balcones fault zone in Texas:
- Describe a set of cavernous geologic units as the potential habitat of the endangered karst species.
- Combine the cavernous units to create a rasterized cost surface at a 1-meter resolution.
- Assign each pixel a value of 1 as the cost distance a species would have to travel to distribute itself throughout the cavernous unit.
- Analyze the possible geographic ranges for each species using the Distance Allocation tool to model their boundaries.
- Compare the modeled ranges for each species and genus with previously established KFRs and karst zones to update those boundaries as needed.
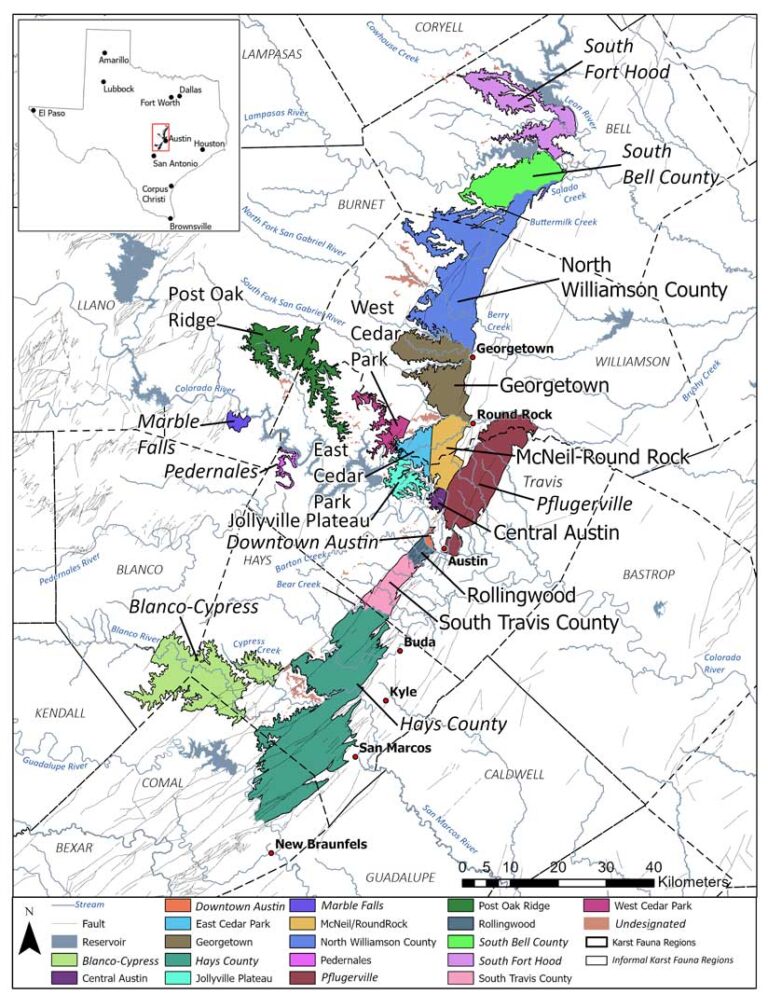
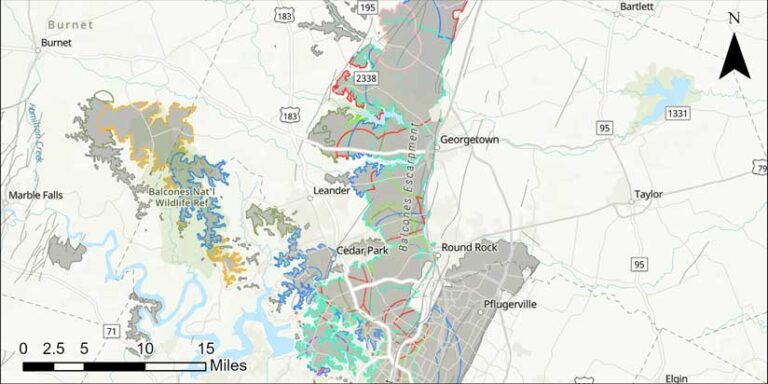
The GIS modeling identified 15 range margin clusters as potential KFR boundaries. Of the eight original KFR boundaries, the GIS analysis supported five, modified three, and eliminated one. Additionally, the analysis established two new boundaries, dividing an existing KFR into two. Further, the investigation created eight informal KFRs for the regions that constrain the distribution of the endangered species.
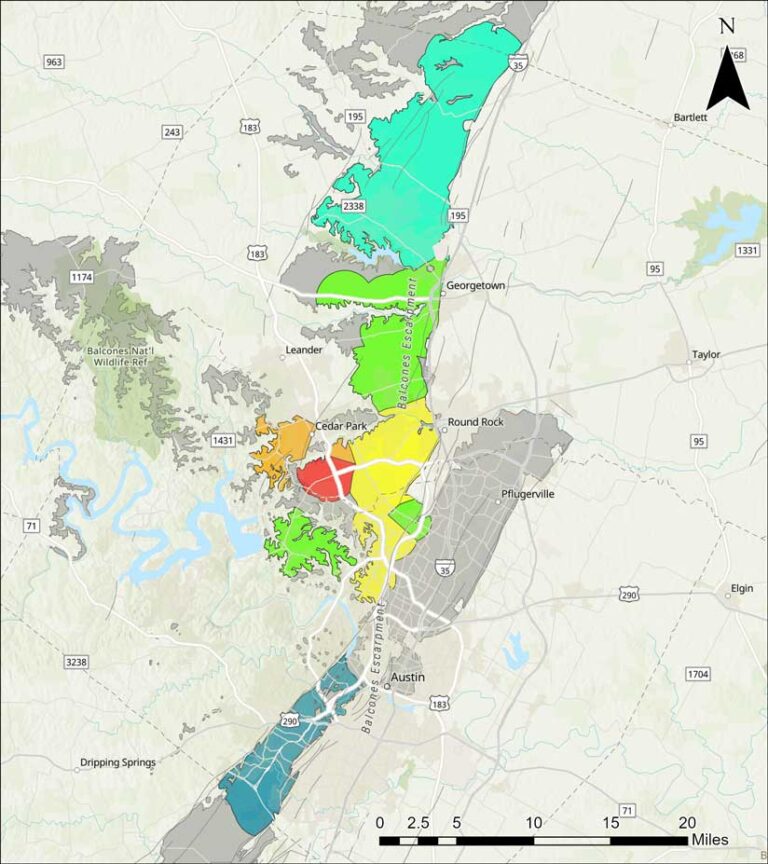
The GIS model also suggested modifications to the karst zones. Biospeleological surveys reported more localities for the listed endangered species since the previous karst zone revision in 2007. Zone 1, where endangered species are known to occur, grew to fill many of the former Zone 2 areas, which had a high probability for their presence. In addition, the number of karst zones expanded from the previous four to include two subzones for zones 3 and 4. These subzones were needed to identify their biological status more precisely than previously defined so that their ecosystems can be better managed.
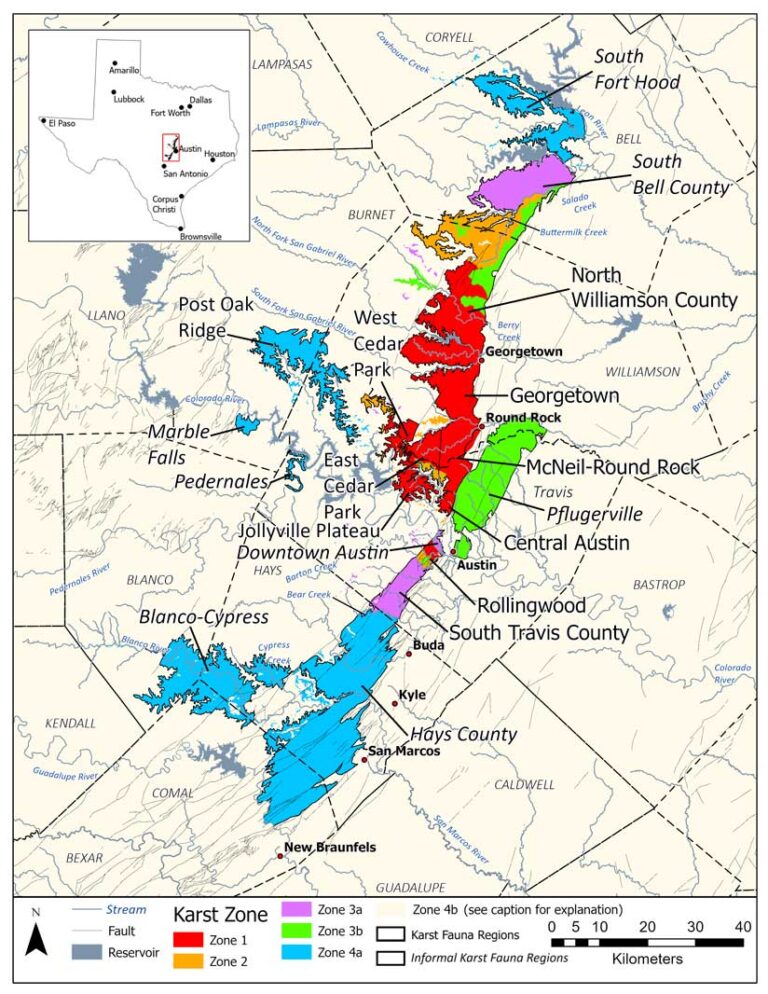
NCKRI based the subzones on their potential for different, nonendangered ecological communities versus potential cave and karst occurrence. In addition to the new localities, the GIS distribution modeling proved a valuable tool in revising the karst zones. The GIS modeling provided a more quantifiable justification for the location of the boundaries throughout the study area, especially where little or no geologic or other potential boundary condition was apparent.
Since the completion of this report, released as NCKRI Report of Investigation 10 (available for free download from www.nckri.org/publications/reports-of-investigation/ with all the project’s details), USFWS has updated its endangered species management guidance based on the new results. In addition, the modeling method is described in detail in the report for use as a template for objectively and statistically delineating the ranges of karst troglobites in other areas. (Karst troglobites is a species that lives only in caves and associated cavities.)
For more information, go to the USFWS website. For more information about the modeling methods, contact
George Veni.
Acknowledgments
This research was funded by USFWS and supported by exceptional technical assistance from Jenny Wilson, USFWS karst invertebrate lead. James Reddell provided the species data and a wealth of information that made this project possible. The Texas Speleological Survey provided invaluable access to its files for cave location and other crucial information. Special thanks go to Bernard Szukalski, David Johnson, and the rest of the Geo Experience Center team of Esri, who generously provided the repeatable Python workflow Jupyter Notebook to speed up multiple geoprocessing commands during the GIS modeling, and an independent in-depth analysis of the model. Additionally, many others supplied data and insights that improved the quality of this study.
About the author