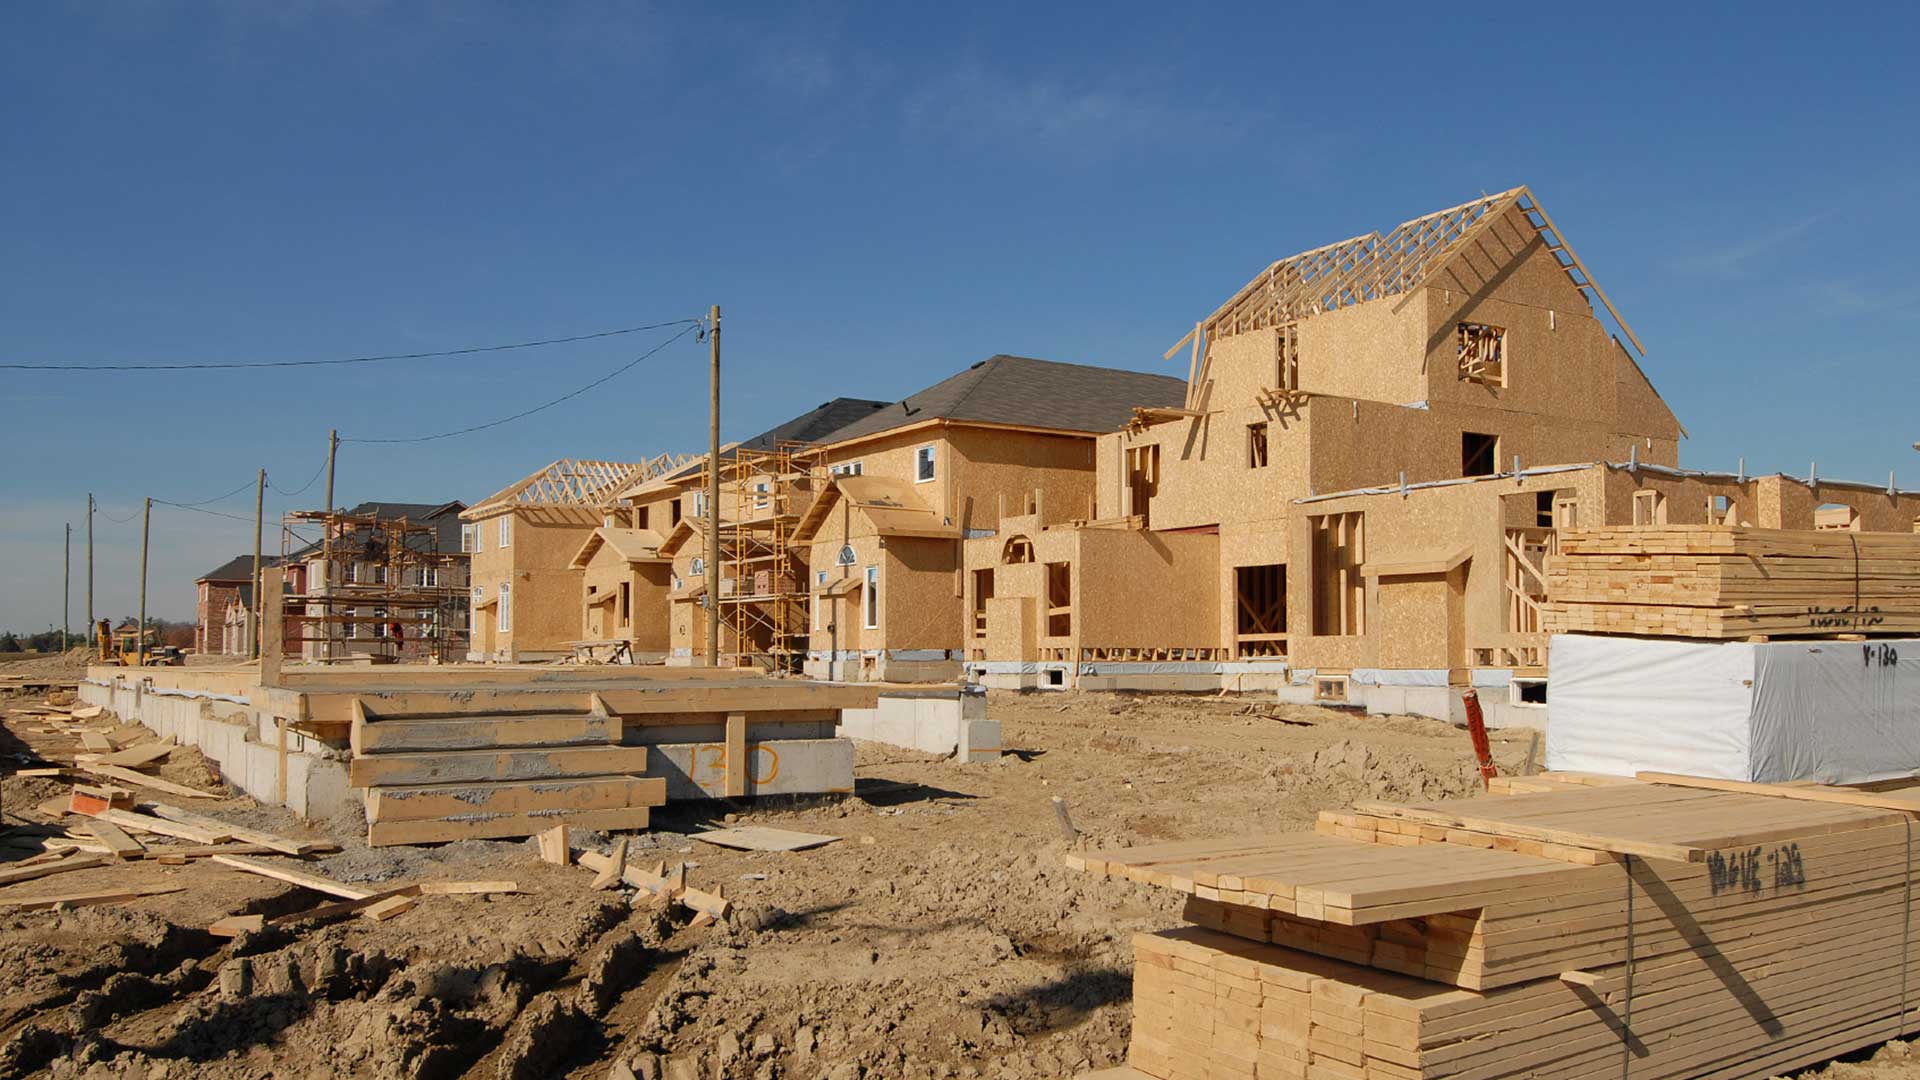
A data-driven approach to planning is key to justifying specific designs and developments for a community. This approach moves from a strictly anecdotal approach to one that focuses on attainable metrics.
As a planner, you have an advantage over others in your organization because you understand the types of designs and developments that are likely to look and work best in a neighborhood. A data-driven approach helps you quantify and qualify your recommendations.
While this is true in the planning of specific developments, it’s also equally true in validating policy for determining where and why developments are needed. Often, these policies are created at a higher level—a level removed from the city manager, planning commissioner, or elected official who designs the development.
Planners and GIS play an integral role in housing policy decisions because location is at the center of this topic. Planners and policy makers must be able to define the needs, benefits, and challenges associated with assigning specific areas for affordable housing.
They must balance a variety of concerns: encouraging economic development, mitigating homelessness, and understanding the capacity for growth in neighborhoods.
This process starts with planners identifying and analyzing the demographic and socioeconomic variables for neighborhoods to successfully assess their needs. ArcGIS Community Analyst lets planners view more than 1,700 variables to understand the makeup and needs of neighborhoods down to the census block group level.
From a policy standpoint, this data helps planners understand where affordable housing, combined with a sustainable economic mobility policy, is most needed. But, it’s not just homeowners who are struggling. Renters also make up a large percentage of those who need affordable housing. This is especially true for younger renters. The Esri Maps for Public Policy app, a part of the ArcGIS Living Atlas of the World, provides free access to data that can be used to help validate policy decisions. With this data, you can overlay maps showing renters and homeowners to understand where the most crucial need for affordable housing is located.
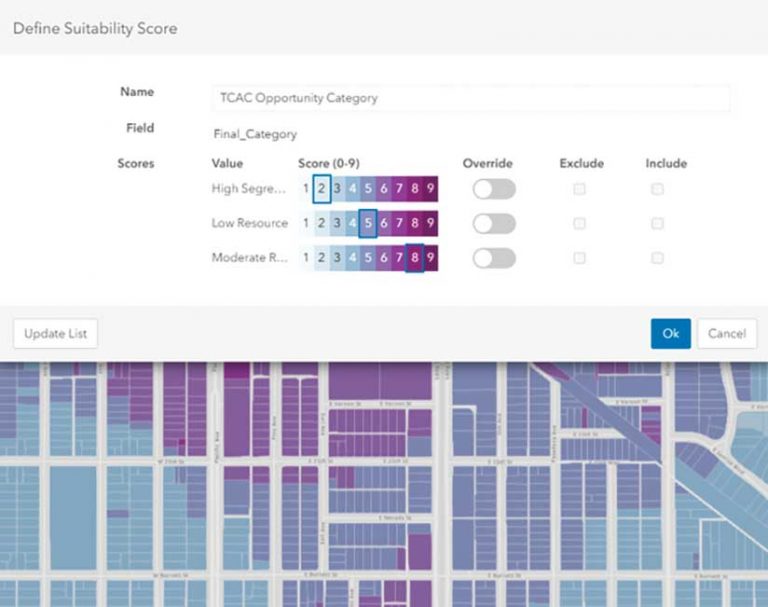
However, there are often additional factors that drive policy making. This is where the Policy Validation Application (PVA), a free add-on to ArcGIS Urban, can come into play. With this add-in, multiple variables can be considered at the same time. By assigning weights to each metric, the best location for affordable housing can be identified down to the parcel level.
Specifically, you can look at the parameters that would drive the feasibility of affordable housing in a neighborhood, such as proximity to available transit, grocery stores, schools, and health services. Affordable housing as a policy doesn’t work unless it’s coupled to economic mobility, so you also want to look at employment opportunities currently available and those planned for an area.
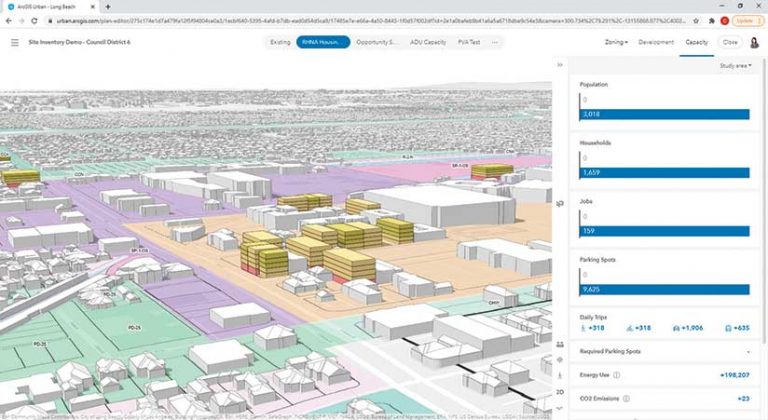
Now, administrators, elected officials, stakeholders—and of course, planners—can have a data-driven discussion about where affordable housing is needed and the best locations and methods to address that need. There’s no ambiguity about the data. It’s clear-cut, and everyone can be on the same page.
Taking a data-driven approach to site suitability, planners can develop multiple housing scenarios in neighborhoods and measure their potential effectiveness. Policy makers can then evaluate and visualize these scenarios, collaborate with community leaders, and engage the public to meet their expectations for transparency and accountability.