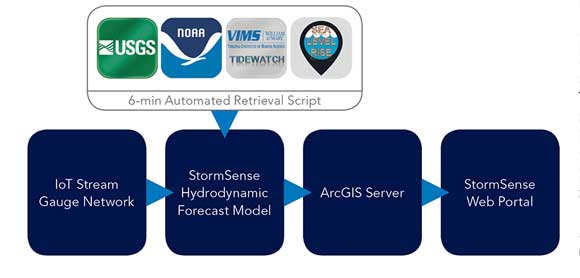
The StormSense project is an innovative and award-winning inundation forecasting research initiative. It uses ArcGIS mapping to visualize the data from a network of Internet of Things (IoT)-enabled water level sensors and information from the hydrodynamic flood modeling and forecasting capabilities of the Virginia Institute of Marine Science (VIMS) at the College of William & Mary and its VIMS TideWatch network.
This smart city project’s objective is to enhance the capability of communities to prepare for and respond to the disastrous impacts of sea level rise and coastal flooding in ways that are replicable, scalable, measurable, and can make a comparable difference.
As tidal flooding is becoming an increasingly pervasive problem for coastal communities, these tidal forecasts are quickly becoming a mainstay for traffic advisories and emergency management. Additionally, the new sensors densify the previously sparse sensor network to provide additional points of validation for the VIMS street-level hydrodynamic model to aid in guiding improvement for future forecasts.
The project’s objective is in the spirit of the National Institute of Standards and Technology (NIST) Global City Teams Challenge. StormSense was awarded its initial funding by NIST through a Replicable Smart City Technologies project grant in 2016. StormSense’s goal is to enhance the field of emergency preparedness by advancing research to help predict flooding resulting from storm surge, rain, and tides.
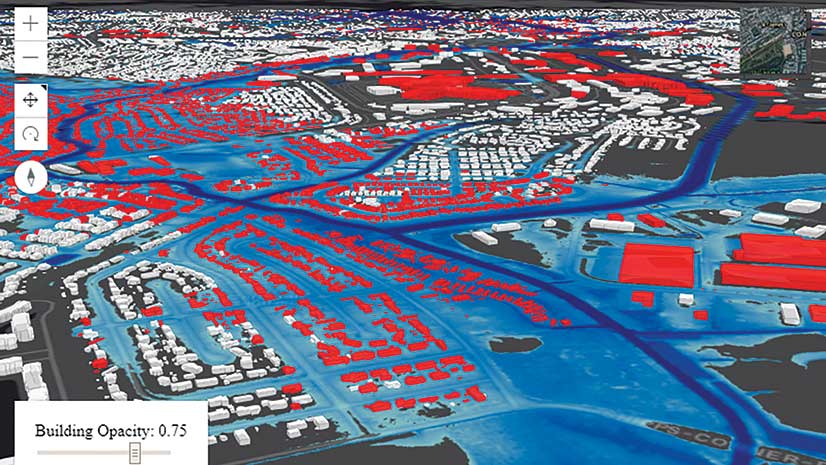
This is translated in a meaningful way by informing map viewers where, when, and for how long flooding will occur. The depth of floodwaters is depicted in 3D.
The project’s scope encompasses the interests of coastal local governments in Hampton Roads, Virginia, including the cities of Virginia Beach, Newport News, Norfolk, Chesapeake, Portsmouth, Hampton, Williamsburg, Poquoson, Suffolk, and York and Gloucester Counties. StormSense has installed or ingested existing sensors in these communities into its network.
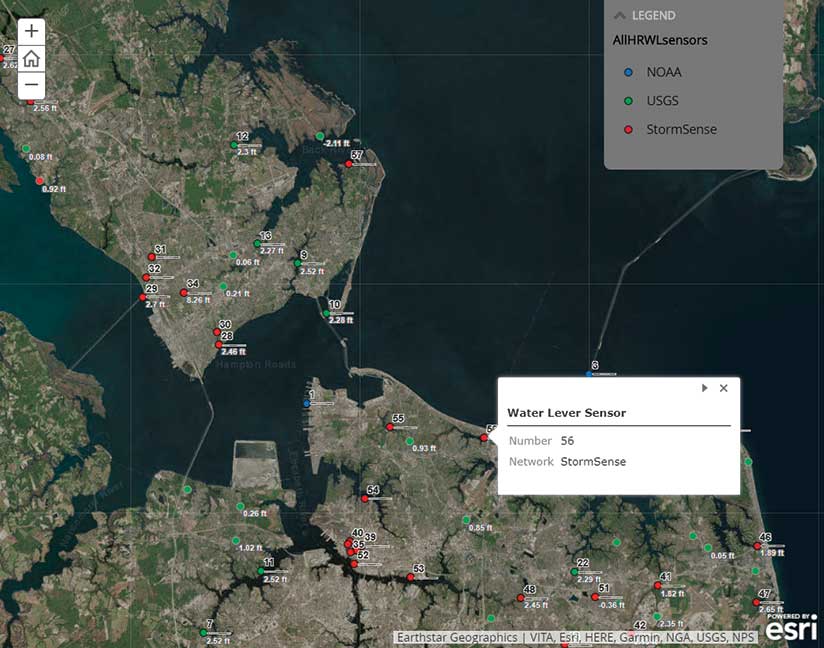
These sensors, located throughout the Tidewater region of Virginia, inform the VIMS’ Tidewatch tidal prediction model by ingesting data from a handful of federally owned sensors that were previously installed and data from 28 new water level sensors installed in 2017 by StormSense. The data from these sensors is reported in near real time on the StormSense.com website.
A Proactive Approach to Risk
While being proactive about assessing flood risk is an emergency management mantra, GIS tools are typically funded in response to a specific event. The Flood Inundation Mapping and Alert Network (FIMAN), a component of North Carolina Floodplain Mapping Program (NCFMP), was developed in response to Hurricane Floyd in 1999. [See “A Real-Time Flood Warning System” in the Winter 2016 issue of ArcUser.] Similarly, the Iowa Flood Center (IFC) was started after a nearly statewide flooding event in 2008.
For FIMAN, the defining event was Hurricane Floyd in 1999; for the Iowa Flood Center, it was a nearly statewide rainfall-driven flooding event in 2008. In Virginia, impetus for developing GIS tools for StormSense was Hurricane Matthew. In 2016, the state legislature established the Commonwealth Center for Recurrent Flooding Resiliency (CCRFR) as a virtual flood center between the Virginia Institute of Marine Science, Old Dominion University, and the Virginia Coastal Policy Center at the William & Mary Law School.
Because it was immediately preceded by Tropical Storm Julia, which left many storm drainage systems at nearly maximum capacity, Hurricane Matthew caused multiple dam breaks in South Carolina and caused soil above an already high water table in North Carolina and Virginia to instantly reach its saturation point and cause widespread flooding. The Virginia state legislature established the CCRFR to function as a one-stop shop for supporting the Commonwealth, state agencies, localities, and other entities with scientific and technical support in furtherance of recurrent flooding resiliency in the face of storms like Hurricane Matthew in 2016.
Methods for Predicting Flooding
StormSense’s workflow bears some similarities to North Carolina’s FIMAN network with the key distinction of its use of hydrodynamic modeling to drive flood forecasts versus interpolated elevations from nearby sensors. The main difference between the two networks is that StormSense adds hydrodynamic modeling to rectify flood forecasts in the coastal zone up to 36 hours in advance. This is also in contrast to the National Water Model (NWM) forecasts, which employ a stream reach algorithm to interpolate United States Geological Survey (USGS) stream flow values and interpret flow accumulation paths downstream. The NWM method is relatively effective in rivers with a one-way gravity-driven flow, but in tidal estuaries the approach is greatly complicated. This is where the NWM and FIMAN have a difficult time interpolating between sensors alone to accurately characterize multidirectional flow regimes in tidal areas for stream flow and inundation applications, respectively.
Programs like the one at IFC have successfully employed the riverine approach to predict flooding in riverine conditions. These programs have done this by aggregating water level, stream flow, and data from its rain gauges and those of federal entities such as the National Weather Service (NWS) and USGS to provide a useful statewide resource for calculating impending flood risk and estimating downstream flood inundation using precached flood raster layers at defined vertical intervals corresponding with real-time water levels at sensors.
StormSense is employing a similar approach using precached flood layers for real-time tidal flood mapping at sensors. However, substantial flood forecasts require the use of a physics-based hydrodynamic model to capture wind-driven storm surges and characterize the influence of the Gulf Stream.
Visualizing Flooding from Hurricane Matthew
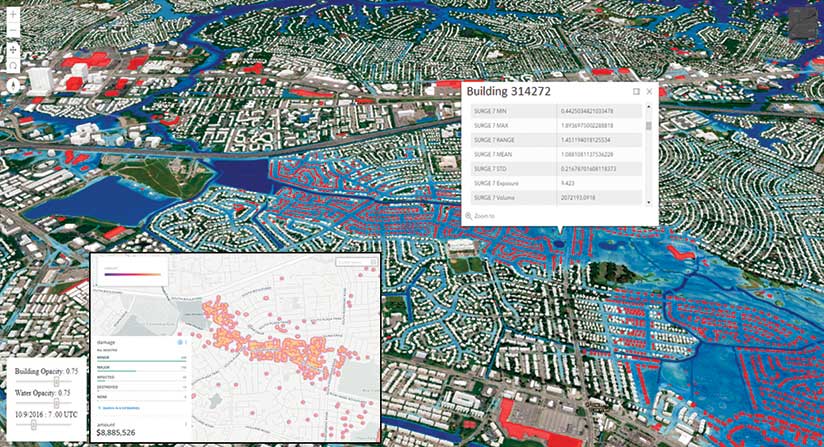
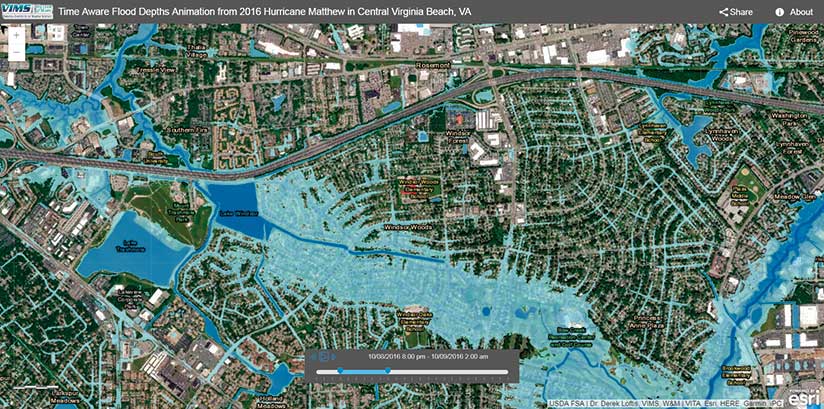
The flood impact of Hurricane Matthew was visualized using a dynamic series of flood layers in inland Virginia Beach, Virginia, driven by VIMS Street Level Hydrodynamic Model using 24 tiled flood rasters that were generated hourly on October 9, 2016, between 00:00–23:00 UTC.
The 3D building layers featured were developed from 2013 raw aerial lidar LAS files that were collected by Dewberry and processed by Geoff Taylor of Esri to extract building vertices and faces for optimal flood data presentation in web 3D.
Building-level flood exposure was illustrated by highlighting buildings in red according to the selected time. Selecting a highlighted 3D building displayed the flood height adjacent to the structure in feet.
Successful simulation of 2016 Hurricane Matthew involved spatially varying the rainfall inputs supplied by 21 rain gauges—12 from the Hampton Roads Sanitation District and 9 from the City of Virginia Beach. (These gauges are slated to be operationally ingested into StormSense by the end of 2018.)
Precipitation inputs were counterbalanced by incorporating various factors. One factor was soil infiltration. The StormSense model allows water to percolate through the bottom of the hydrodynamic grid mesh at spatially varying rates determined by translating surface types of varying porosity to coefficients in Richards’ equation, as defined by 1-meter resolution land -cover data. [Richards’ equation, formulated by Lorenzo A. Richards in 1931, represents the movement of water in unsaturated soils.] Six USGS groundwater wells are used to ascertain current depth of the water table as an inversely proportional estimation of the hydraulic conductivity in Richards’ equation.
The locations of storm water drainage infrastructure pipelines and outflow were incorporated from the City of Virginia Beach Open GIS Data portal to best represent guided subterranean fluid transport not accounted for by soil infiltration.
The physics-based hydrodynamic model for Hurricane Matthew is driven with 36-hour forecast water levels from Tidewatch at the map boundaries using three nearby USGS tide gauges ingested into StormSense in Virginia Beach. These three USGS tide gauges (along with seven others, which were permanently installed by the USGS in 2016) and 10 StormSense gauges installed in Virginia City in 2017 have been incorporated into StormSense by Virginia Beach’s chief data scientist Sridhar Katragadda, GIS manager and coordinator Robert Jessen, and their colleagues at Virginia Beach and into the Tidewatch network by Dr. David Forrest at VIMS.
Water levels may also be queried through smart devices that can use Amazon’s virtual voice assistant Alexa via the StormSense Alexa skill that is available from Amazon.
Flood extents were validated by citizen-reported flood maps and water-level sensors in central Virginia Beach, by city street closure maps provided by the City of Virginia Beach, and aerial drone footage from the City of Virginia Beach’s official YouTube channel.
Web 3D brings a realistic and additional dimension to 2D web maps in a way that is powerful and more easily understood. Leveraging GIS time-aware rasters advised by street-level hydrodynamic models can aid in assessing the flood risks of an impending threat in a meaningful way for citizens, first responders, and key decision-makers.
For more information, contact J. Derek Loftis or Geoff Taylor.
About the authors

Jon Derek Loftis