The Internet of Things (IoT) has gained deep traction across the globe in all levels of government and industries. IoT is commonly considered to encompass the billions of physical devices around the world that are connected to the Internet, collecting and sharing data.
IoT gives organizations the ability to collect, process, and analyze vast amounts of real-time data that can reveal real, actionable intelligence. Like other trends in IT, its potential is tempting, but the reality of realizing its value presents certain challenges. With all these devices constantly generating data, this not only creates a data management issue but also the necessity of getting data into a format that allows for the extraction of actionable intelligence.
Context is a critical component that turns IoT data into actionable intelligence. IoT devices are all around us in things such as smartphones, cars, city streetlights, and thermostats. All these connected physical devices share a characteristic: location.
Using GIS to map the location of each device, it can be put into context with its surroundings in the physical world, so we can use spatial analytics to extract actionable intelligence from this context. We can see things that aren’t clear using any other type of technology.
Since many of these devices are in motion, location may change over time. By tracking that location over time, the GIS can analyze the historical track of a device, revealing its continually changing spatial context so we know where and when data was collected. The GIS also lets us integrate IoT data with other spatial data to place that data with what is around it.
Many government agencies are embracing IoT to improve everything from traffic flow to public safety. IoT provides values to government agencies through
- Real-time operational awareness.
- Faster and more efficient response.
- Improved government services.
To realize these benefits, location must be part of the IoT solution. That means integrating the IoT systems with an enterprise GIS.
One example of this is the Waze Connected Citizens Program (CCP). Waze is the world’s largest community-based traffic and navigation app. CCP is a free, two-way data exchange program between government agencies and Waze that can produce impressive benefits for both. By sharing live road closure data from your city directly with Waze so it can be consumed by Waze and Google users, drivers using those services can be automatically routed around road closures.
This is much better than posting closures on your website, because most drivers won’t check it before getting in their cars. Boston, Massachusetts, realized an 18 percent reduction in traffic congestion the first month that its data sharing went live with Waze. [Read about Johns Creek, Georgia, the first city to join CCP, in “An Open Data Strategy Pays Off for Johns Creek” in the Summer 2018 issue of ArcUser.]
Other government agencies are seeing a four- to seven-minute reduction in emergency response times as emergencies are reported on Waze before witnesses report them via 9-1-1. Waze users don’t just report traffic incidents—they also report potholes. By monitoring the pothole reports, government agencies can more quickly respond, patching potholes before they enlarge. This saves money on the patches and saves drivers potential damage to their vehicles.
After the Boston Marathon bombing in 2013, first responders across the city lacked the connectivity and real-time data necessary to coordinate effectively. Without a real-time IoT and GIS platform, it was impossible to relay critical updates and orders among thousands of individual first responders, race participants, volunteers, and spectators.
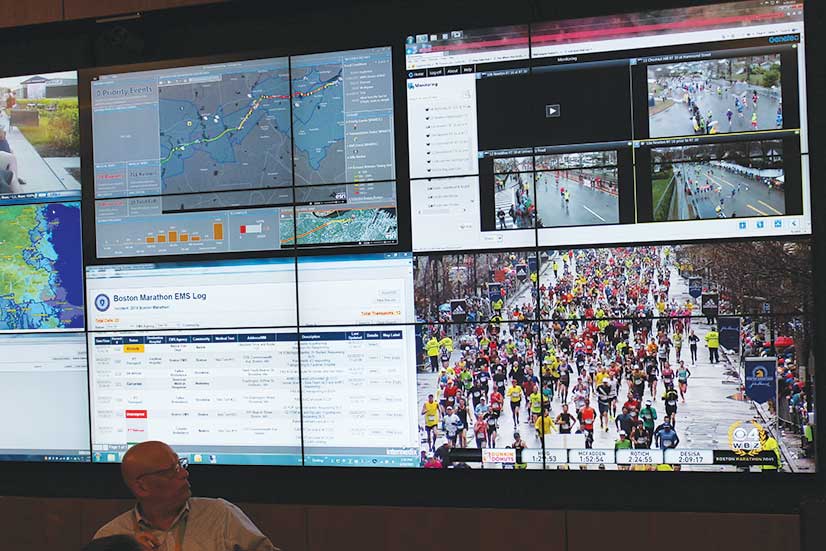
By the 2014 Boston Marathon, things had changed significantly. Public-facing, IoT-enhanced web maps showed live event details such as the race route and the locations of medical facilities and law enforcement staging areas. Integrating data streams from thousands of sensors, devices, video feeds, and locations enabled Boston officials to better address critical aspects of the race, including tracking personnel and resources in real time and shifting public safety assets where needed.
The runners were outfitted with data-producing sensors. This allowed officials to keep track of how many active racers were in the field, as well as how many people were in each section of the course, enabling security and medical resources to be reallocated accordingly.
Not only does IoT and GIS integration support marathon officials in accounting for all participants in motion, but it also serves as the foundation for information being shared quickly and easily among the public, event security, and emergency responders. This benefit proves essential on race day, where 60 different agencies use a common operating picture powered by GIS-based location technology to orchestrate an event that draws a worldwide audience and more than half a million spectators. [Read “ArcGIS Online Runs Security at Boston Marathon” in the Spring 2016 issue of ArcNews to learn more about the use of GIS to enhance security and operations.]
If your organization has an IoT initiative, include plans to integrate it with your GIS. The benefits of both technologies will be much more substantial.