Whether it’s fighting crime, improving public health, or fixing potholes, measuring and managing performance are part of the governing philosophy of former Maryland governor Martin O’Malley. Mapping data on these types of issues using GIS has been one of the core techniques he has used to do it.
Data and Maps Tell the Stories
As a mayor and later as a governor, O’Malley instituted a series of performance measurement and management systems—known as Stat systems—for policing, public works, education, business and economic development, health, and the environment. Maps were a key component of those systems.
The implementation of the Stat systems was considered one of O’Malley’s signature accomplishments during his two terms as the mayor of Baltimore from 1999 to 2007 and two terms as the governor of Maryland from 2007 to 2015. These systems incorporated ArcGIS technology, and the maps created using ArcGIS were used within government to gain insights into problems ranging from crimes such as homicides and robberies to environmental issues such as water pollution and lead poisoning. The maps also were used to measure a wide variety of concerns including infant mortality, drug overdose deaths, and land preservation.
O’Malley believes that data, when mapped, can clearly show people the extent of problems or measure performance. Later, after intervention or adjustments, the maps can also tell stories about the progress being made.

“As human beings, we make sense of things from stories close to home, And maps make things open, apparent, and visible to everyone.”
Making Crime Visible
The first Stat system in the country, known as CompStat, was developed by New York City Police Department (NYPD) deputy commissioner Jack Maple. Maple started mapping crime on paper maps when he was a lieutenant for the New York City Transit Police and brought his methodology to the NYPD after being recruited by the city’s police commissioner, Bill Bratton, in the mid-1990s.
“Jack started doing something in his portion of the subway that led to pretty dramatic reductions in crime,” O’Malley recalled. “He started making, [using] just Magic Markers and paper, maps of where the crime was happening in real time in his portion of the subway. He called his Magic Marker on paper maps ‘Charts of the Future.’ He deployed [officers] to where he knew, based on the past, the purse snatchings and other sorts of crimes were most likely to happen.” This was a rough but early form of predictive policing.
Eventually Maple wound up at a software convention in Manhattan, saw a demonstration of ArcView GIS, a precursor to ArcGIS, and had the NYPD start using the software to plot crimes on a digital map. A television show called The District, which ran from 2000 to 2004, featured Maple’s computer crime mapping system.
In Baltimore, the O’Malley administration hired Maple as a consultant and launched CitiStat, its own version of CompStat, to monitor and map crimes such as homicides, robberies, and drug dealing. The CitiStat system was also set up to map 3-1-1 calls about illegal dumping, blight, street maintenance, flooding, and trash pickup.
CitiStat was also used to monitor data on employee performance. Ultimately it reduced chronic absenteeism and tardiness and overtime spending, which led to cuts of more than $1 million from the budget in five months. The city also used performance measurement tools such as GIS to analyze response times by the fire department and ambulance services, which resulted in the closure of several fire companies, a necessary cost-cutting measure during a recessionary period.
The use of GIS in performance measurement and management systems quickly spread throughout Baltimore city government after O’Malley became mayor, but the Stat program started in the police department. There were two reasons for that.
First, the homicide rate in the mid-1990s in Baltimore was high. More than 300 people were killed each year. “When I ran for mayor of Baltimore in 1999, our city had become the most violent, addicted, and abandoned city in America,” O’Malley said. He was elected on his promise to turn things around.
Second, Maple—the “father” of the NYPD’s CompStat system—was laser focused on and well versed in crime mapping despite the fact he was fighting cancer at the same time.
“Even though he was suffering from a terminal diagnosis for colon cancer,” said O’Malley, “he agreed to come help me as our consultant to not only put police reforms in place and make our city safer but to take that same approach of the common platform—the data, the method, and the map—and do it enterprise-wide.”
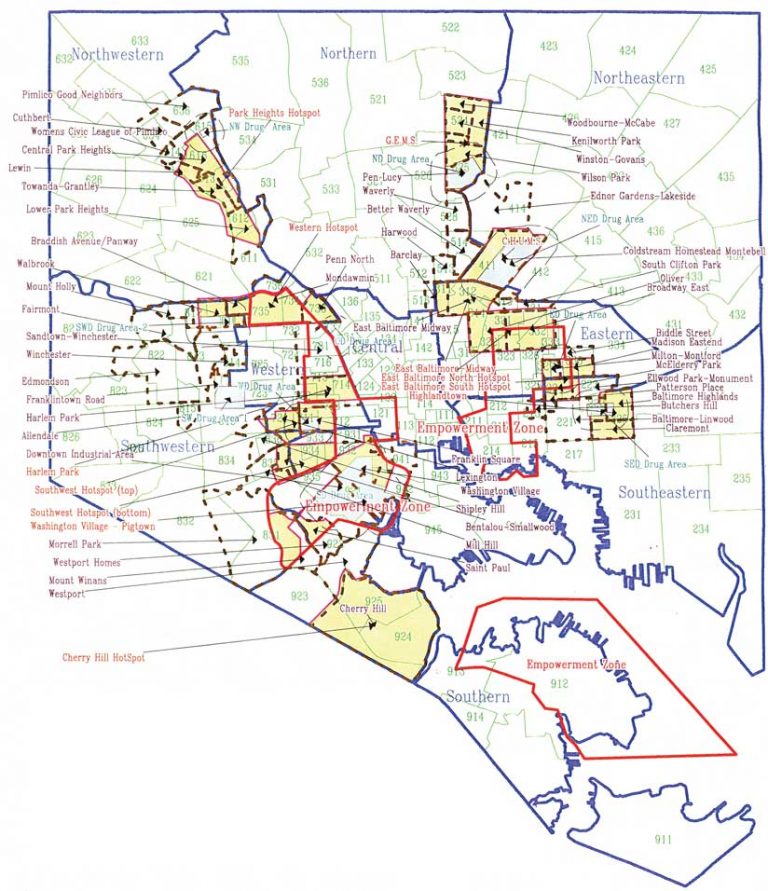
Though elated about his election, the new mayor knew he had big problems to deal with. One of the first things O’Malley and Maple tackled was to rid the city of the open-air drug markets that fomented much of the violence. CompStat maps showed all hot spots for crime in relation to the location of the open-air drug markets. This helped police officials, city leaders, and community activists decide which markets to target and close first.
Next, the City of Baltimore created the CitiStat system and meeting room, with computer screens on the wall for displaying relevant graphs and maps. There, O’Malley would meet with staff and tackle issues facing Baltimore in the early 2000s. Citizen complaints—such as graffiti sprayed on walls or trash dumped in an alley—coming in on the 3-1-1 system were mapped, too. Every two weeks, staff met to go over progress on these types of issues and view maps or graphs with data that O’Malley called “the latest emerging truth.”
Information that had sat in silos in one department now appeared on maps with information from other departments. In that way, O’Malley and his team could begin to see patterns that would help them make smarter decisions.
“Everybody had to open their data and land the individual silos of information on the map,” O’Malley said. “It all became mapped, and that map became a living, breathing thing.”
Mapping the Big Picture
Shortly after O’Malley became governor of Maryland, he met Esri president Jack Dangermond for the first time. He said Dangermond gave him a demonstration using empty coffee cups spread across a table to represent different silos of information from various departments.
“Jack said, ‘You’ve already figured out something that most elected leaders haven’t—you’ve realized that the map and GIS are a common powerful platform to combine those separate silos of information that everybody in government bemoans. If you land the base of all these efforts—all these separate silos of information—on the same map, then the map creates a picture, and then you can start running plays.’”
O’Malley did just that. Starting in 2007, he instituted StateStat to measure almost every facet of government performance including that of the Maryland State Police and the departments of Health and Mental Hygiene; Juvenile Services; General Services; Labor, Licensing, and Regulation; Housing and Community Development; Business and Economic Development; Veterans Affairs; and the State Highway Department. BayStat was launched to monitor progress toward cleaning up pollution and restoring the oyster population in Chesapeake Bay, and DrugStat was started to measure the performance of drug treatment programs in Baltimore.
Many of these systems relied on maps to gauge what was happening. StateStat measured progress on 16 goals that included addressing childhood hunger, infant mortality, substance abuse, preventable hospitalizations, violent crime, and energy efficiency. Underpinning the performance measurement and management systems were the maps produced using ArcGIS. Dashboards, some of which included maps Esri helped create, were published online, showing if progress was being made. Transparency is critical to achieving good results, according to O’Malley.
A New Way of Governing
In Smarter Government: How to Govern for Results in the Information Age, published by Esri Press, O’Malley lays out his philosophy in full. He outlines his approach to leadership and governance as one that’s long on collaboration, transparency, accountability, and data-driven decision-making with help from supporting technologies like GIS.
The book is geared toward current and aspiring government leaders and others who work in public service. Though it mainly focuses on how to be an effective leader and achieve results using data-driven performance management and predictive analytics systems, readers also will find links to 35 online GIS exercises or tutorials.
“I see a new way of governing emerging all across our country and the world,” he said. “It’s rising up from smart cities where men and women who lead these cities have figured out that the new default setting is not to hold information but to make [it] open and transparent and clear and visible—to create dashboards not only for your internal use but [ones] that every citizen can see whether we are making progress or not.”
O’Malley sees his book as unique among books written about leadership, management, and technology because in it he shows how he combined collaborative leadership techniques with the use of the Stat to achieve desired results, whether it was to shut open-air drug markets or reduce lead poisoning cases among children.
This is O’Malley’s first book. It comes after a long political career, including roles as a city council member in Baltimore, the mayor of Baltimore, the governor of Maryland, and a candidate for president of the United States.
O’Malley said. “We have better technology than a self-governing people have ever had in the history of the planet to measure, model, and map not only our built and natural environment but the human dynamic that unfolds across it and to be able to do it in ways that all can see. Those are relatively new tools. What we need, as fast as the technology has advanced, [is to] catch up with the sociotechnical habits of leadership and management and collaboration that allow us to deliver real, tangible things—safer neighborhoods, cleaner water, better schools.”
Martin O’Malley’s explains mapping and smarter government in this video.