In recent years, the term smart has been widely applied to all kinds of things: appliances; electric meters; networks; buildings; and, most especially, to cities. Initially, it was applied without much justification or explanation. Smart was an adjective—not a strategy—and was decoupled from results.
However, the concept of smart has been evolving. Esri is refocusing the conversation around smart from vague promises to a specific geospatial strategy that can deliver the results communities seek. Smart, in the context of government, is associated with the use of real-time data, 3D visualization, the application of artificial intelligence for automation and optimization, and other technologies being enlisted to improve the lives of citizens. These technologies provide new ways to deal with challenges such as failing infrastructure, increasing demands on government services, threats to the environment, and the need for social equity.
By looking at communities that had truly become smart, patterns of adoption became apparent. Successful communities have a strategy that is connected to the operational goals that enhance sustainability, resilience, livability, health, safety, and prosperity. The use of smart strategies began in communities but is increasingly adopted at county and state levels.
Recognizing that implementing a smart strategy requires both data and technology, Esri has developed a Smart Community Information System that encourages an integrated approach so communities can identify priorities, improve processes, and achieve organizational goals.
Why Smart Is Spatial
In government, location is never an afterthought. Where is what connects people around a project and provides context. Location plays a critical role in everything government does, from long-range planning to asset management, from public safety response to addressing citizen requests. Smart devices, the Internet of Things (IoT), and cloud computing feed data on the locations of people, nature, vehicles, and infrastructure. The complex data needed for government’s myriad missions is brought together by GIS so that it is easier to understand, analyze, and act on. Smart communities thrive when location is at the forefront of operations.
“We look at everything through the lens of geography,” said Chris Thomas, director of government marketing at Esri. “Everything we do requires a focal point, which is where people live, work, and play. This is why GIS is recognized as a foundational part of every smart strategy.”
Supporting Smart
Geospatial information is the foundation for building a Smart Community Information System and GIS is the technology for implementing it. Smart Community Information Systems are organized around four technology tenets:
- Planning and Engineering
- Operational Efficiency
- Data-Driven Performance
- Civic Inclusion
These systems encompass data and solutions and require implementation, training, and partners.
1. Planning and Engineering
Smart communities must balance the often competing demands of built and natural environments with the additional challenges of economic stress and climate change. In implementing smart communities, the focus on planning and engineering is not limited to the work traditionally done by municipal departments with those names but more broadly refers to meeting community needs through urban design that is human centered to produce resilient and sustainable communities. By incorporating 3D visualizations, benchmarks, and analysis, communities can balance the needs of people, infrastructure, and the environment by modeling the impacts of proposed development, adjusting plans to accommodate changing demographics and lifestyles, and accounting for the effects of climate change and economic shifts.
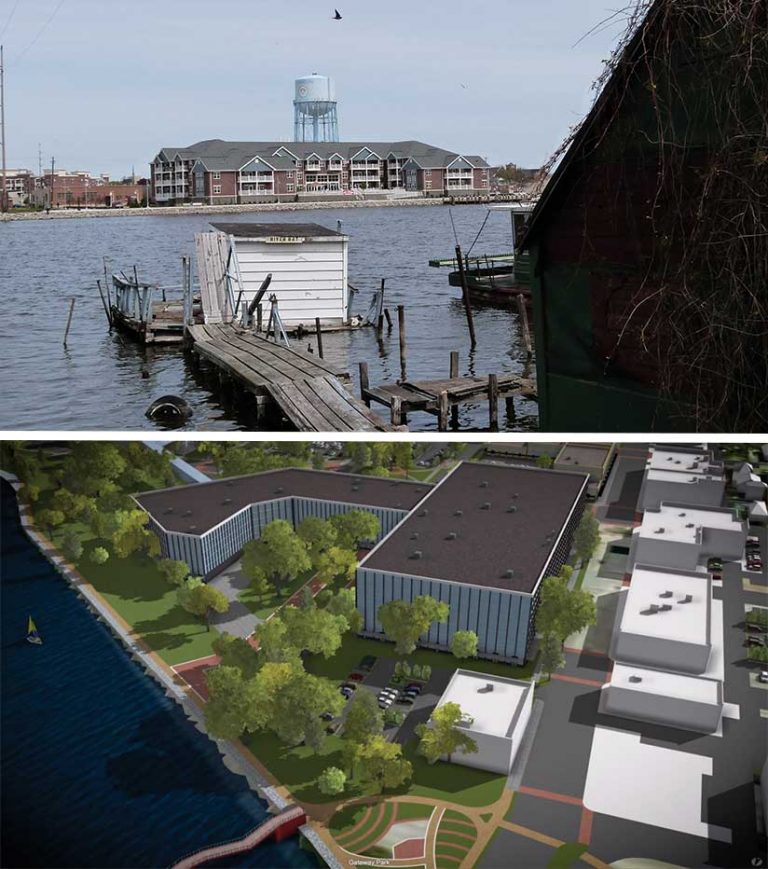
Seeing the Future: City of Oshkosh, Wisconsin
The City of Oshkosh, located on the shores of Lake Winnebago in northeast Wisconsin, was founded in the 1800s as a center for lumber and other industries. As these industries declined in recent years, taking jobs away and leaving behind dilapidated and vacant buildings, the city realized it needed a plan for reinvigorating the local economy.
It responded with Imagine Oshkosh, a 10-year strategy for promoting growth and investment in the greater downtown area. This strategy relies on GIS to plan and visualize a vibrant and prosperous future. Esri Community Analyst and Esri Business Analyst provided a deeper understanding of Oshkosh’s demographics and economic strengths that could be shared with developers and other investors.
For example, a developer hoping to attract a minor league baseball team to the city turned to Esri partner Houseal Lavigne Associates, which used Esri CityEngine to create a 3D visualization of the proposed entertainment district along the waterfront that would house offices, retail, multifamily homes, and an arena for the team. The Milwaukee Bucks could see the city’s potential and were sold on the project. City residents, who could see Imagine Oshkosh’s vision, thanks to 3D visualization, were enthusiastic supporters of the project.
2. Operational Efficiency
Operational efficiency is just good government. GIS supports a broad range of technologies—from field mobility to the use of virtual assistants for open data access—that promote operational efficiency. GIS collects information in real time and feeds it back into the system, where it can be displayed and analyzed by dashboards. Making more efficient use of resources reduces the cost of government.
Improved workflows also support more responsive services by intelligently allocating resources where they are most beneficial. A GIS-based Smart Community Information System collects data in real time, performs analysis, and makes the resultant information available as the basis for better decisions through performance dashboards. More efficient workflows come from collecting data directly in the field and making it centrally available so it can be acted on immediately, thus eliminating inefficient and potentially error-prone paper capture and manual updates. Streamlining processes saves time, maximizes resources, and improves response times. By using dashboards, story maps, and web apps, the information produced can be shared with government staff and constituents in ways that are easy to understand, widely accessible, and convenient.
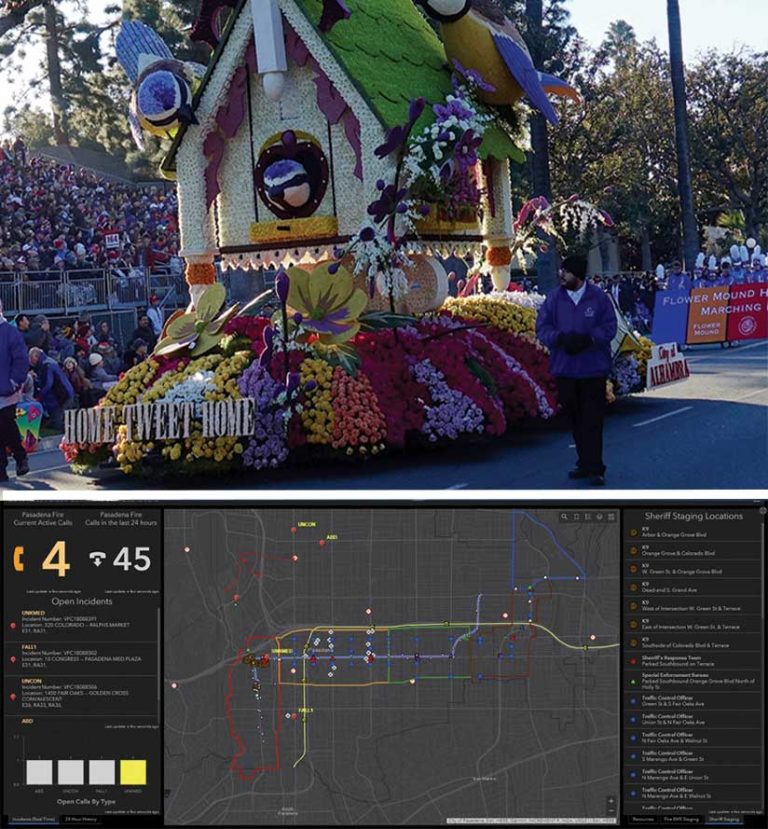
Optimizing Coordination and Decisions for the Rose Parade
Each year, hundreds of thousands of people line Colorado Boulevard in Pasadena, California, to view the Pasadena Tournament of Roses, a parade billed as “America’s New Year Celebration,” as another 76 million around the world watch the event on television. Departments across the City of Pasadena and planning committees work together to coordinate the event and ensure the well-being of spectators and the hundreds of people participating in the parade. In the decades since the parade debuted in 1890, its success and the safety of the fragile floral floats that are the event’s centerpiece have been threatened by rain, high winds, and wildfires.
“In the past, we’ve only had information in paper format,” said Oscar Sepulveda III, captain-paramedic with the City of Pasadena Fire Department. The city moved to a GIS-based strategy that uses mobile devices and dashboards. The Pasadena Fire Department uses Tracker for ArcGIS to capture real-time data about parade floats, fire department assets, and medical incidents. Live maps are easily shared with multiple fire chiefs, the Federal Bureau of Investigation, the Department of Homeland Security, and officers working at the event. These maps improve coordination across various agencies and response to potential hazards.
“For the past four years, we’ve been working on utilizing technology to give us the up-to-date information that we need to make decisions that are going to impact safety,” said Pasadena fire chief Bertral Washington. [Watch a presentation by the City of Pasadena on the Rose Parade.]
3. Data-Driven Performance
Linking data with location to improve decisions using GIS is nothing new. In 2000, Martin O’Malley, then mayor of Baltimore, Maryland, used a GIS-based tool called CitiStat that brought performance management and accountability to the city and reduced waste and inefficiency in government operations.
The difference now is the great increase in the amount of data that can be analyzed, incorporated, and communicated and the great decrease in the time required to do this using GIS. With the Smart Community Information System, real-time data harvested from mobile devices and device sensors connected through the IoT is analyzed using an ever-growing toolset that includes artificial intelligence capabilities and rapidly shared with decision-makers using dashboards and other visualization tools.
Esri is uniquely able to support government decisions driven by data and analytics because it is also a demographic and lifestyle company. It provides current-year estimates and five-year projections of demographic data with 2,000 variables; Tapestry market segmentation; and data on consumer spending, market potential, business locations, major shopping centers, traffic counts, crime indexes, United States Census, and American Community Survey.
With GIS, current and historical data, from many sources and in many formats, can be analyzed at a rate that enables more rapid decision-making and increases the pace of government services.
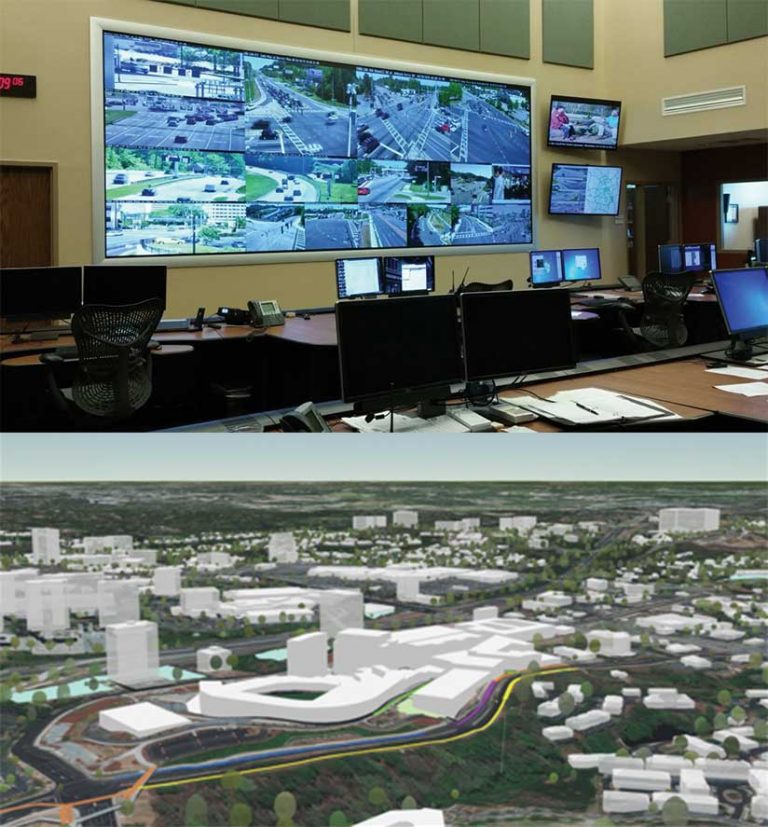
Using Real-Time Data to Improve Traffic
Instead of relying on historic traffic data to time its traffic signals, Cobb County, Georgia, is improving transportation management across the community by modifying traffic patterns in real time. The county has incorporated GIS into its Sydney Coordinated Adaptive Traffic System (SCATS) and can manage the flows of both automotive and pedestrian traffic by changing traffic signals. The system incorporates the variables that cause congestion and applies artificial intelligence to optimize system coordination. Real-time road closure, traffic accident, vehicle, and pedestrian data is fed to an operations dashboard monitored by traffic managers who adjust traffic flows as necessary. [Listen to Sharon Stanley, director of Information Services Department at Cobb County, Georgia, describe her county’s digital transformation and use of GIS to drive performance.]
4. Civic Inclusion
Smart communities use technology to improve the lives of citizens. Citizens now expect government that is responsive, convenient, and transparent. Because people care about where they live, citizens want to work with government to meet community needs and challenges and shape their future. By using story maps and ArcGIS Hub sites on topics that range from capital improvement projects to the opioid overdose epidemic, GIS enables smart communities to more effectively communicate with citizens and enlist their participation. With tools such as ArcGIS Insights, governments can analyze data on demographics and behavior to inform policies so services reach the people that most need them.
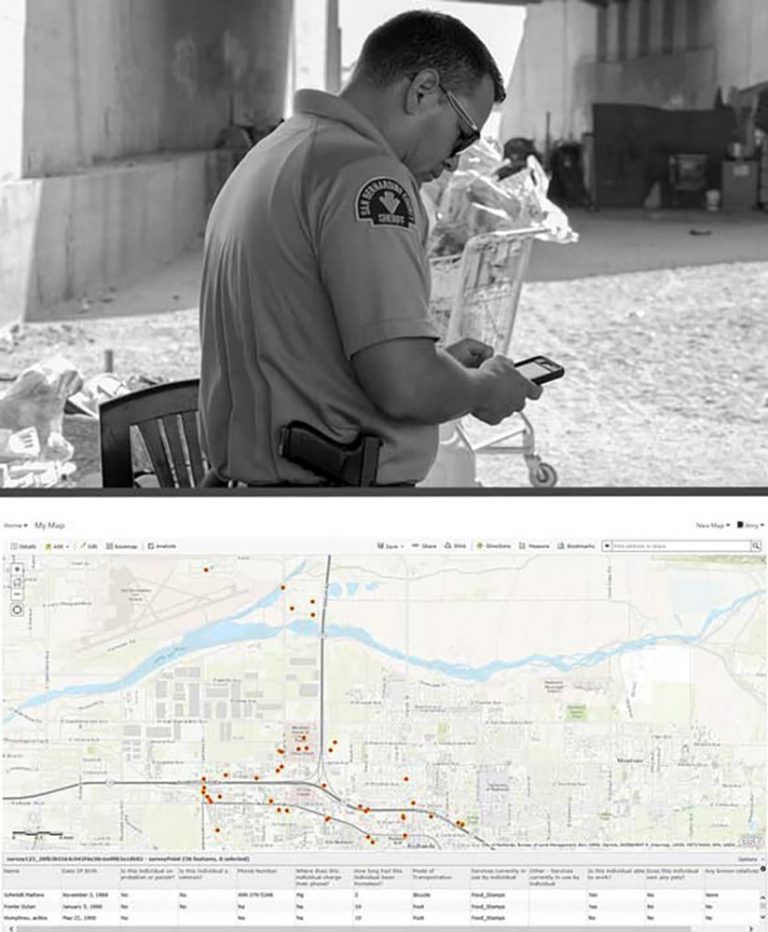
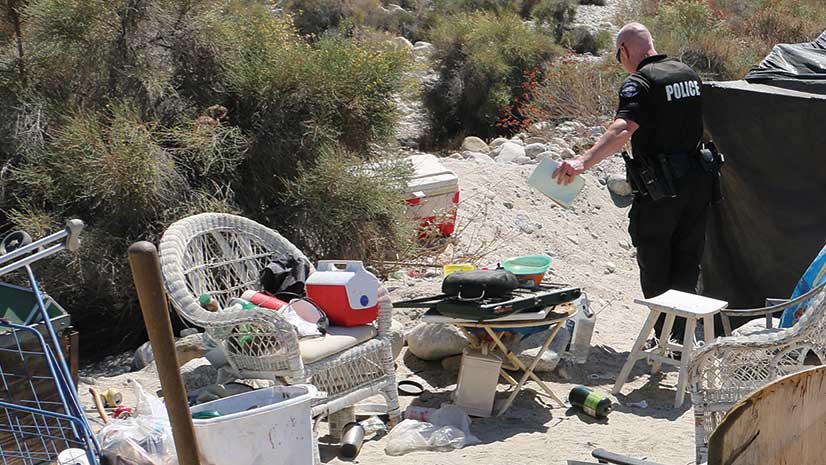
Mitigating the Burden of Homelessness
The San Bernardino County Sheriff’s Department’s Homeless Outreach and Proactive Enforcement (H.O.P.E.) program links homeless people with the resources they need to transition from life on the street and reduces the costs associated with crime and blight related to homelessness. The program’s goal is to improve the quality of life for all citizens in the Southern California county.
By using solutions that are configurations of mobile apps, such as Survey123 for ArcGIS and Collector for ArcGIS, with Operations Dashboard for ArcGIS, deputies document and share information on homeless persons and track the location of their camps. This GIS-based strategy provides an overview of contact with the homeless people over time and space that can be queried by name, age, timeline, or other factors.
This information was critical when water being released from a dam threatened homeless people camping in the riverbeds. This information was shared with county agencies so homeless people living in camps in the floodplain could be warned and relocated. [Read more about the work of H.O.P.E. in “Applying GIS to ‘Everybody’s Problem.’”
Smart Is a Process
GIS is fundamental for building smart communities. Smart communities don’t result from one app or one project. They are the result of an iterative process that builds on successes and learns from failures, with the goal of a more responsive, effective, and inclusive community in mind. Consequently, a smart community will change over time. Smart is a journey enabled by GIS.