Gases, flammable liquids and solids, explosives, oxidizing agents, poisonous substances, radioactive materials, and corrosives are dangerous materials that are essential to industries such as manufacturing and agriculture, but their transport poses risks.
In Canada, approximately 30 million shipments of dangerous goods are transported across the country each year. Transport Canada, a federal institution responsible for all transportation policies and programs, oversees these shipments.
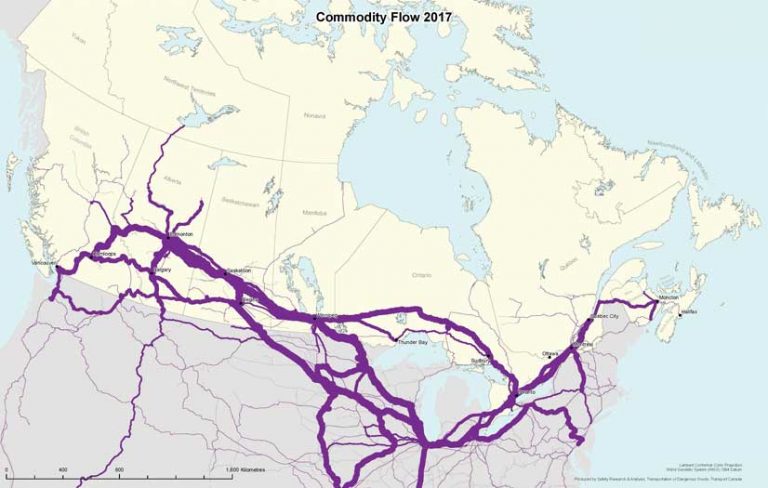
About 25 percent of those shipments are transported by rail. To analyze the movement of dangerous goods along 78,000 kilometers (48,500 miles) of railway track, Transport Canada creates commodity flow maps that identify the types and amounts of dangerous goods transported through specified geographic areas. These maps allow safety risks and trends to be evaluated and help forecast demand for the future movement of these goods. The maps can contribute to the identification of spots where there may be a greater risk in moving dangerous goods and provide the locations of emergency services along those routes.
Flow maps were originally developed by Charles Joseph Minard, a French civil engineer, who is recognized for his contribution to the field of information graphics. His first flow map, created in 1845, depicted the routing of a railway line between Dijon and Mulhouse, two cities located in eastern France. Most commonly, flow maps indicate the route used by goods or people in transportation networks and represent the volume of goods or people by the thickness of the route line.
“The Safety Research and Analysis branch under the Transportation of Dangerous Goods Directorate at Transport Canada implemented its ArcGIS platform in 2014,” said Elise Pietroniro, team lead for the branch’s GIS team. The team created the commodity flow processes using rail data in Microsoft Excel spreadsheets that were interpreted with Python scripts to validate data and isolate the relevant information that was subsequently visualized and analyzed using the ArcGIS Network Analyst extension.
According to Pietroniro, the advantage of commodity flow maps is that they provide an easy-to-understand visual context for very complex data analyses. In rail transportation, they can be used to spatially analyze data across multiple variables for safety assessment including emergency response services, population density, sensitive infrastructure, and topography.
“The commodity flow process models segments of the railway network and provides connectivity between those segments to develop a least impedance routing solution. That is, it determines the best route for a particular cargo, based on various criteria,” noted Pietroniro.
These criteria include data from a variety of sources. The distance traveled from origin to destination and the railway track ownership are examples of impedance factors. The origin and destination of the goods, rail carrier, and international border crossings in and out of Canada (if applicable) are used in the analysis as well as the Standard Point Location Code (SPLC). An SPLC is a 9-digit geographic reference code used in the United States, Canada, and Mexico that specifies the location of railway stations within those countries. It is maintained by the American Association of Railways. Commodity type and volumes are used along with the routing analysis to generate a commodity flow map.
“The collected data used in our impedance analysis comprises our network datasets. From it, we run the script we created to extract that information needed for network routing analysis within Network Analyst, which creates our commodity flow model and the resulting flow maps,” said Pietroniro. “The script analyzes route segments using specific logic and validation checks to ensure verifiable results. Among a variety of checks, the methodology ignores invalid SPLC codes, detects apparent conflicts in rail carriers along a specified route, and reveals inconsistencies regarding border crossings.”
Because the network datasets used for the route analysis are extracted from thousands of records that contain millions of georeferenced vertices, a series of steps are used for the processing of this data to avoid memory errors. The outcome from the multi-step geoprocessing procedure is later aggregated into total railcar counts per railway route segment. The route analysis results are applied to map templates with standardized layouts and symbology. The resultant maps depict the volume and direction of dangerous goods as they move along a specified rail line from origin to destination. Map templates are available for different regions and on a variety of scales. The entire data analysis and map production process takes between 15 and 45 minutes.
Previously, all this work was done by hand. “The spreadsheets were manually parsed to extract the routing data that was necessary for the analysis. From the analysis, a map was created to depict the commodity flow,” said Pietroniro. The manual process normally took about two weeks to create a single flow map, and because each was designed individually, there was no continuity between them.
Pietroniro has plans to extend the use of commodity flow maps. “In the future, we would like to animate the commodity flows for rail transport to provide a greater sense of how, when, and where the flow of dangerous goods increase and decrease.” This methodology may be applied to other transportation modes used for moving dangerous goods that also fall under the responsibility of the Transportation of Dangerous Goods Act (1992).
“Linking the commodity flow of dangerous goods by other modes with our existing commodity flow model for rail transport would provide us with a door-to-door visualization of the transportation of dangerous goods throughout the country. This could be used to implement greater safety measures and provide more efficient transportation services.”
About the author