Faster, more accurate, and spatially enabling
A pilot project by a northern California water district developed a GIS-based paperless process for inventorying and managing its assets that is simple for field staff and integrates with existing management systems.

The Santa Clara Valley Water District (SCVWD) manages an integrated water resources system. It ensures the supply of clean, safe water and provides flood protection and stewardship of streams on behalf of Santa Clara County’s 1.8 million residents. The district effectively manages 10 dams and surface water reservoirs, three water treatment plants, a state-of-the-art water quality laboratory, nearly 400 acres of groundwater recharge ponds, and more than 275 miles of streams.
The District-wide Asset Management Unit (DWAMU) started a pilot program to help SCVWD manage assets along the streams and rivers under its care. Assets include the creek itself, bank lining, levees, outfalls, and many other waterway structures, both man-made and natural.
DWAMU assigns each asset a Business Risk Exposure (BRE) value, which is a numeric value derived from two other values: the consequence of failure (a relatively static number based on economic, environmental, and other similar factors) and the probability of failure (a number given to an asset during a condition assessment of that asset).
DWAMU wanted field staff not only to inventory assets in the field but also to locate and note problems associated with those assets. For example, field staff might document an eroded 20-foot-long section along a 1,000-foot-long bank lining. Both the asset (bank lining) and condition (eroded section) records need to be related. Even if this condition is corrected, an area may be inspected from year to year. Photos would need to be attached to these records to document conditions.
Paper spreadsheets, photos, and paper maps were initially used for field data collection. However, lots of asset data already existed in SCVWD GIS datasets, and DWAMU was interested in using mobile software and hardware for data collection to go paperless and help workers orient themselves in the field.
By managing asset data in IBM’s Maximo, a computerized maintenance management system (CMMS), the district could leverage Maximo’s reporting, preventive maintenance, work order, and asset management capabilities. This would allow SCVWD to track an asset’s life cycle and monetary costs for use in reports and maintenance scheduling.
GIS and Maximo analysts sat down with DWAMU and field staff to gather the requirements for the data they wanted to collect. A geodatabase was developed with tables and coded domain values that would standardize data collection and apply codes already used in Maximo and other legacy systems. The relationships between assets, condition assessments, and inspections soon became apparent. One asset can have many conditions, and one condition can have many inspections.
Another DWAMU requirement was the use of an asset hierarchy structure. Each SCVWD flood control zone contains a certain number of creeks. Each creek has defined reaches. Each reach has a left bank, right bank, and bed. A left bank, right bank, or bed may have child assets such as bank lining, bed lining, or weirs. Collection of these child assets depends on whether an individual child asset warrants management or not.
Finally, DWAMU needed both asset and condition assessment data to sync with Maximo. All data, including photos of conditions and assets, should be easily uploaded and postprocessed so that field staff would be comfortable using the system.
Implementing
After looking at these project requirements and available software products, DWAMU decided to use Esri’s ArcPad mobile field mapping and data collection software. ArcPad was chosen because it can use multiple GIS layers and is compatible with equipment that had already been purchased for the project. ArcPad is also relatively easy to customize. It can be used offline or online, can be used for editing existing GIS features and related nonspatial tables in the field, and allows photos to be attached to records.
District GIS analysts were given Trimble Yuma tablets, digital cameras with Bluetooth capabilities, and a few ArcPad licenses to develop a single solution that met all requirements. Staff members were trained to use ArcPad by GeoMobile Innovations Inc., a training and consulting company out of Corvallis, Oregon. The company also helped GIS analysts customize the ArcPad interface.
Once trained, GIS analysts could modify code and develop automated processes that made the system easy for field staff to use. GIS analysts leveraged ArcPad’s ability to relate features to tabular records to build inspection record forms. Field staff record all scoring and measurement values in the inspection forms. This is also where the probability-of-failure scores are inserted as well as pictures.
A Simple Process
The process for a typical creek inspection is composed of just a few steps.
After getting oriented in the field using the GPS and background GIS layers, the user clicks on the map near the location of an asset being inspected and chooses the correct asset for assessment.
The user records the location of any condition related to that asset, either by digitizing it or using GPS data capture, and chooses the condition assessment category.
The user adds an inspection, takes measurements, scores the condition, and adds comments if necessary.
The user takes a picture, sends the picture to the Trimble Yuma using Bluetooth, and attaches that picture to the inspection record.
The asset inventory is very similar. In fact, the user can inventory an asset and do a condition assessment on the fly and preserve data integrity through the use of unique identifiers and a series of built-in validation steps for each record.
Postprocessing
GIS analysts used ArcGIS ModelBuilder, Python scripting, ArcPad Studio, and Visual Basic to create a series of automated processes that ensure data integrity and simplify the task of checking data in and out.
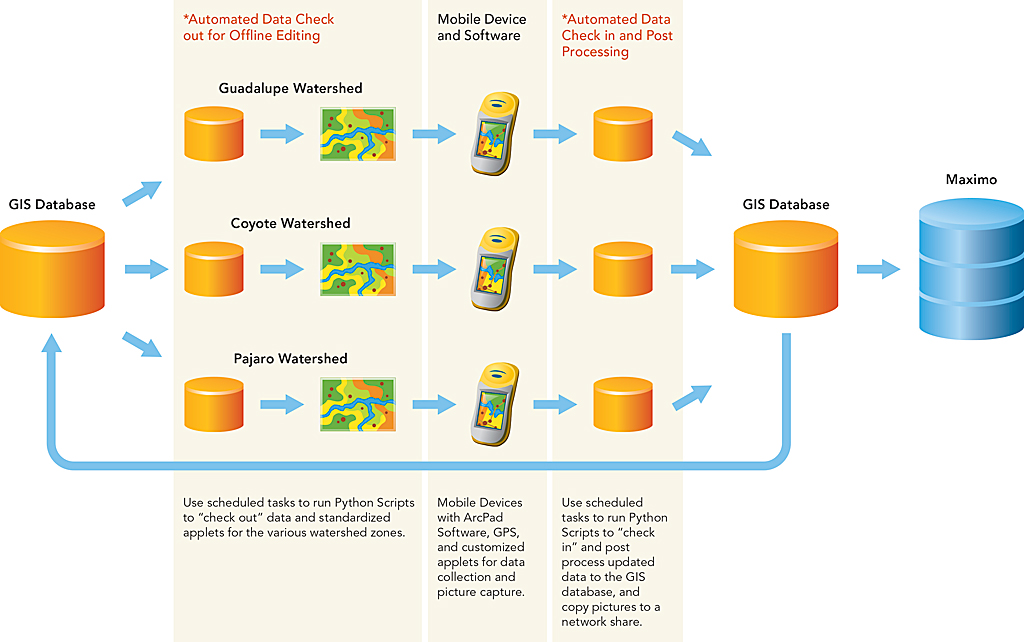
The ArcPad templates created for each flood control zone include customized data collection forms, along with the code and background datasets used, so every flood control zone project looks the same. Users simply pick the flood control zone they are working in for that day. Everything they need is transferred to the mobile device for offline editing.
Back in the office, the user can perform QA/QC on the data before checking it in. When the data is ready, the user docks the tablet and connects to the network. The user simply chooses which flood control zone worked in that day, and data and pictures are automatically copied to the network. Updates are seen the next day.
At night, a Python script runs a check-in to transfer the data into an Oracle database using ArcSDE. Next, a number of Python scripts update picture paths and extract and populate waterway linear referencing measures as well as coordinates. After postprocessing, Python scripts run again to check out a fresh set of ArcPad projects for use the next day. Once updates are in the enterprise geodatabase, an application developed by activeG, LLC, syncs asset and condition data with the correct Maximo tables.
Summary
Since this project went live in July 2012, more than 4,000 inspection records have been captured in the field, and more than 5,000 assets have been identified. SCVWD field staff members now perform paperless inspections in a uniform manner that saves time by avoiding hand entry of data into legacy systems. By adding a geographic component to this data, SCVWD managers and engineers can see patterns and perform spatial analyses using data they would previously have seen only in tabular format. The system also allows work to be prioritized in a seamless fashion while managing watershed assets. For more information, contact Kurt Hassy.