Unique event for the ocean GIS community
How can we go fast with what we’ve got?
That was the challenge Jack Dangermond posed to 50 key members of the oceans science and resource community who were invited to Esri corporate headquarters in Redlands, California, for the Oceans Summit on November 7–8, 2012.
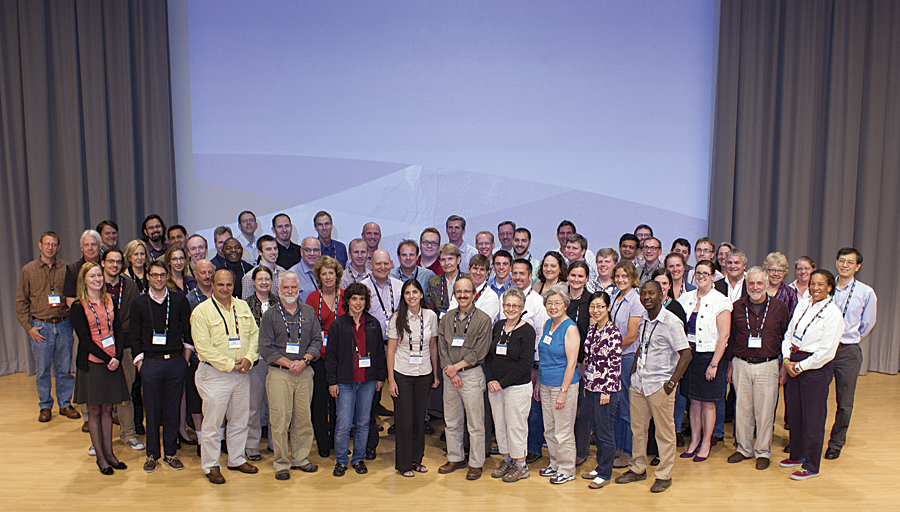
The first—and only—Esri Oceans Summit was held to identify the challenges to using GIS in the ocean environment and establish a community of GIS ocean interests independent of Esri. Attendees were associated with academic and research institutes, government agencies, nonprofit organizations, consultants, and ocean-related businesses that use GIS in the marine environment. They were led by Dawn Wright, Esri’s chief science officer, and joined by 40 Esri staff members, many from software development.
Part of a Larger Plan
“The oceans are like our lungs and we are smoking,” Dangermond said, underlining the urgent need to both understand and preserve the oceans. The Oceans Summit is part of Esri’s long-term commitment to applying the lessons learned on land to the ocean: Esri’s Ocean GIS Initiative [PDF].
Wright announced the initiative in July 2012 at the Esri International User Conference. In that speech, she emphasized the critical role oceans play. “The oceans provide over half the oxygen that we breathe. They regulate all our weather patterns, they feed us, they provide for our energy and economy—so in reality, the oceans are vital to all of us, no matter where we live.”
GIS has long provided the tools to arrive at solutions to problems such as competition for natural resources. Now Esri is joining the oceans community to extend that GIS to explore and preserve the earth’s last frontier.
However, applying GIS in the marine environment is challenging. The oceans—from the sea surface to the seafloor—are hard to penetrate with sensing devices. Satellites and lidar can’t see all the way through the water in all places. Many marine research topic areas require capturing, managing, and analyzing 3D and 4D data. Datasets incorporating these dimensions are huge and currently problematic to ingest and analyze. Because of these and other issues, currently only 5 to 10 percent of the oceans are mapped at a level of detail comparable to land.
A Different Approach
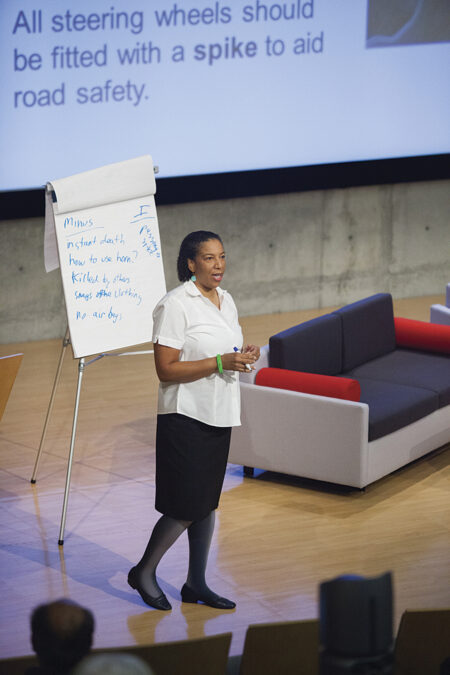
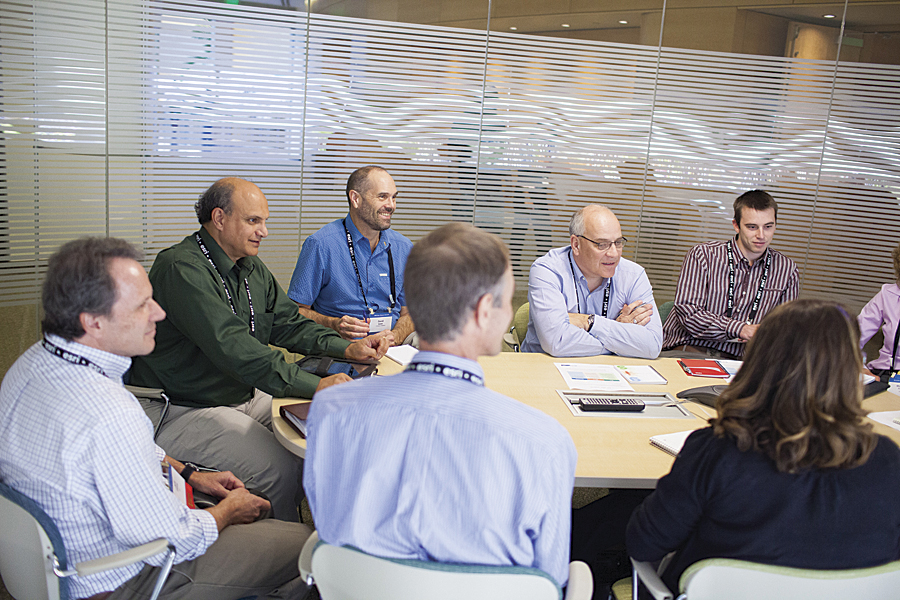
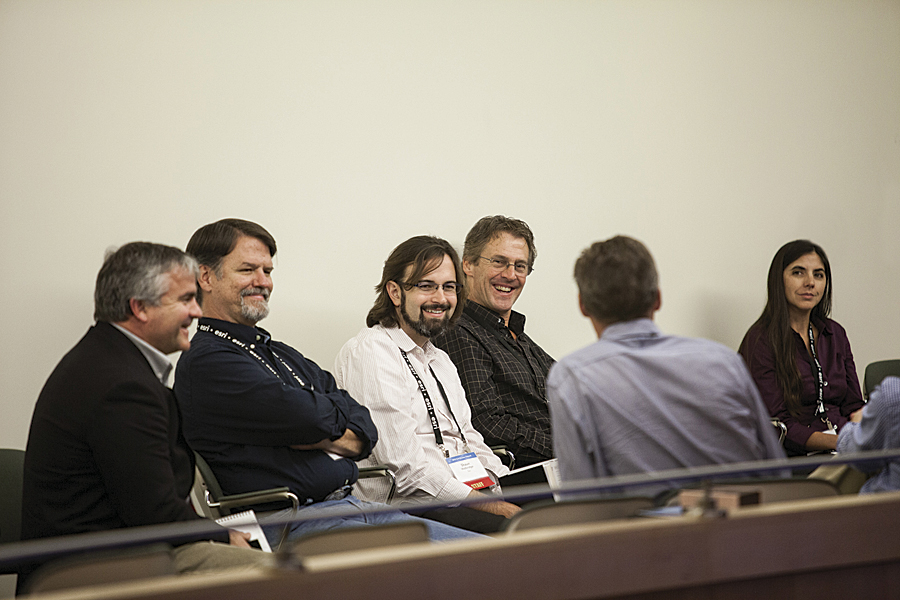
Rather than a traditional conference, this was a high-level workshop that had just one deliverable: the Oceans Strategic Plan. Instead of listening to and giving presentations, attendees spent most of their time in breakout sessions with Esri staff.
The first day, sessions focused on identifying the barriers to GIS use in the ocean environment. Breakout groups were organized for marine geology and geophysics, physical and chemical oceanography and ocean observing, marine ecology, fisheries science, and coastal and marine spatial planning. The methodology for all groups was the same. Each group identified the positive ways GIS helped in their specific area and where functionality should be extended.
For example, members of the fisheries science group agreed that GIS was valuable for data integration, communication, and analysis tools. Because all regulation is spatially presented, GIS is critical to monitoring and enforcement work and facilitates analyses that are both defensible and repeatable.
A critical area for improvement was integration with OPeNDAP (Open-source Project for a Network Data Access Protocol), a data transport architecture and protocol—originally designed and developed by oceanographers and computer scientists for oceanographic data—that is widely used in the scientific community. The ability to handle 3D and 4D data was another top request as well as more domain-specific functionality and the ability to better handle huge datasets.
At the end of the day, all breakout groups reconvened and presented their findings. Many of the desires of the fisheries group were echoed by other groups. Additional areas for improvement included work with vertical datums, along with transformation issues generally, and quantifying uncertainty in data. The first day concluded with a sustainable seafood dinner in the Esri Café éprovided by summit participant Clearwater Seafoods.
On the second day, breakout sessions were organized around extending and integrating GIS technology. As Dangermond noted in his remarks opening the summit, the goal was more than just adding functionality. Ultimately, he wants Esri to equip this community with “tools that will actually change the workflows and the way we think about the oceans and the way we act in relation to them.”
On this day, breakout groups focused on multidimensional data formats, primarily Network Common Data Form (netCDF), hierarchical data format (HDF), and OpeNDAP; working in 3D and 4D; analytic tools and associated workflows; and data distribution in the context of servers, services, and computing platforms. In each group, members identified existing functionality in ArcGIS that was beneficial and suggested ways for evolving the software to better meet their needs and integrate with other software commonly used in their workflows.
An Ocean of Data
During the summit, almost every discussion revolved around data issues. Studying and monitoring the world’s oceans, in all their vastness and complexity, requires staggering amounts of data and functionality not typically required for terrestial GIS.
There is a need to incorporate vertical coordinate systems and develop a true 4D data model. Ingesting, analyzing, and managing datasets on this scale is a formidable task. Dynamic views of constantly changing datasets are needed.
Some of the most important data is available in formats that are not commonly used in studying the landscape. The work of many marine scientists requires extensive use of netCDF data. The netCDF toolbox, released with ArcGIS 10.1, has proved helpful.
Summit attendee Tiffany Vance, who is a geographer with the National Oceanic and Atmospheric Administration (NOAA) National Marine Fisheries Service, affirmed the value of “closely integrating new types of data into Esri—netCDF is a good example where the Esri team is continually working to develop new utilities and applications while also handling more and more types of netCDF files. For us, the ability to use netCDF in ArcGIS has been critical both in our day-to-day work and in making GIS a more usable tool for modelers and physical oceanographers.”
In addition to these specific needs, attendees noted on their wish lists items familiar to all GIS users: the need for data structure standardization, for better and more easily maintained metadata, better discoverability of data and tools, and improved tool performance.
The adoption of Python as the standard scripting language for ArcGIS was hailed as a great improvement in customization and integration opportunities, but that did not negate the overwhelming call for integration with MATLAB, a tool for numerical computation and visualization that is used extensively by both the ocean and atmospheric research communities. There is also the continuing need to integrate with existing tools developed by the oceans community like Marine Geospatial Ecology Tools (MGET) developed by Marine Geospatial Ecology Lab at Duke University.
A new take on interactive data publishing was also suggested. In addition to publishing the data associated with a journal article, the geospatial tools used in analysis would be shared. Such a strategy would “push ocean science forward.”
Common Themes
The summit’s final session summarized the directions for both GIS technology and ocean science and management suggested by the breakout groups, addressing the summit’s first goal. Although members of the groups came from many disciplines, the same issues—management and analysis of huge datasets, the effective visualization of this data, and the challenge of working with 3D and 4D data—came up again and again. It was noted repeatedly that GIS capabilities required by the oceans community were very similar to those needed by the atmospheric community. This valuable feedback, along with clarification of GIS functional requirements for ocean science and various use cases, will guide future development of the ArcGIS system.
The second goal—encouraging the development of a community that uses GIS to promote ocean research and preservation—seemed to have also been met by the event. Summit attendee James Graham, who is a visiting professor at Oregon State University (OSU) within the Geography, Environmental Science, and Marine Resource Management (GEM) Discipline Group of the College of Earth, Ocean, and Atmospheric Sciences (CEOAS) and a research scientist at Colorado State University, enjoyed “meeting and talking with such a great group of folks who are interested in helping improve our understanding of the ocean.”
The Esri Oceans Summit set the course for GIS development in the service of ocean science. The next phase is the inaugural Esri Ocean GIS Conference. This event, open to all comers, will have regular paper sessions and panels, map galleries, and demos. It is tentatively scheduled for November 5–7, 2013, in Redlands.
About the author