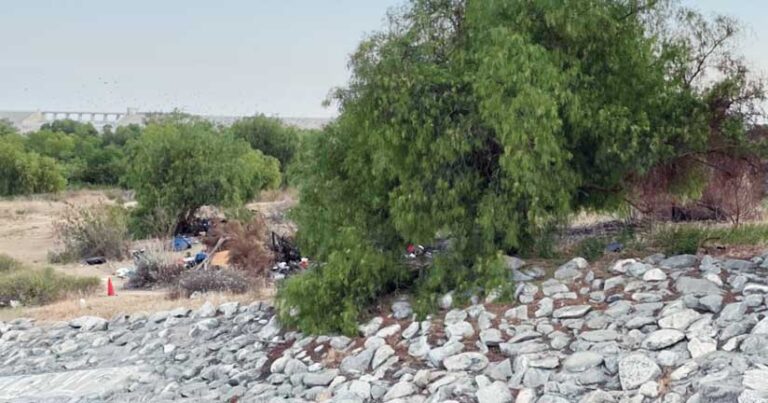
Students at a Los Angeles high school used web maps, GIS, and infrared technologies to identify the location of homeless encampments in high-risk fire areas. The completed map was shared with the Los Angeles Fire Department and will be used to help in future wildfire evacuations.
Knowing where unhoused populations are sheltering is vital during wildfire evacuations. The numbers of both wildfires and unhoused people have grown in California. The forests, fields, and hills in urban areas are full of dry brush due to drought. The results of the 2020 Greater Los Angeles Homeless Count showed that the number of residents experiencing homelessness grew 12.7 percent in 2020 to 66,426 people—many of them sheltering on the dry, open land.
The students from Anderson W. Clark Magnet High School, whose school borders the Angeles National Forest in Glendale, set out to prove that infrared images analyzed with GIS technology could identify homeless encampments near areas at high risk of wildfire.
A Geographic Approach to Research
The curriculum at Anderson W. Clark Magnet High School integrates technology with core academics, including an honors course in GIS remote sensing. Spanning six weeks in 2021, 12 students enrolled in the course collaborated to build, program, and test what’s known as a cube satellite, or CubeSat, prototype. These square miniature research satellites are used to collect data and take measurements. CubeSat prototypes are built with inexpensive materials and tested at low layers of Earth’s atmosphere using balloons, drones, amateur rockets, or small aircraft.
The students’ CubeSat project was part of the US Department of Education’s CTE Mission: CubeSat challenge, which calls for designing, building, and testing a cube satellite prototype to tackle issues important to local communities.
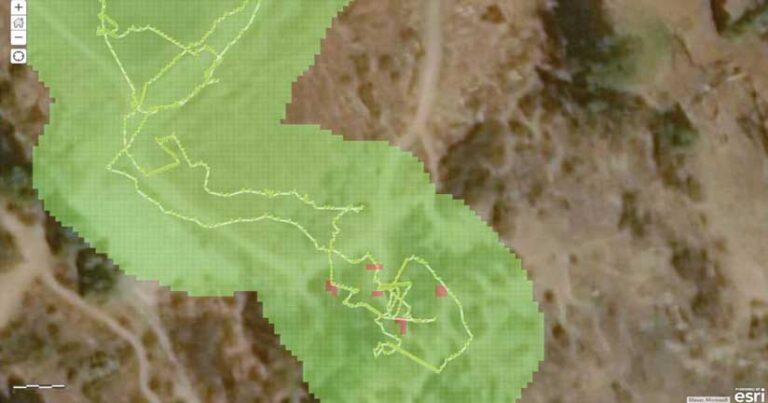
To make the prototype, the students chose infrared sensors that could detect heat signatures, and a GPS receiver to map the locations of high-risk encampments. For the building phase, students were divided into two teams: one for the flight station and the other for the ground station.
Ensuring that each student had an opportunity to design a piece of the project, they self-assigned roles based on interest. Each student was also responsible for a secondary role such as managing documentation, writing the flight report, or determining the best location for the test. They learned to assemble and program their CubeSat prototype with instructional videos from their teacher as well as information on YouTube and online forums.
“Throughout the project, I consistently was on forums looking up how to make stuff work. CubeSats are not a widely used product, but there was so much information about them online,” said Matthew Keshishian, one of the students who worked on the project.
Keshishian added that programming the prototype’s onboard computer was personally challenging because he created three code variations. He conducted a test flight over the school to determine which code worked best with the sensors and camera. “We needed a code that was easy to use in most situations, since we weren’t sure how we would import the data into a map at that point,” Keshishian said.
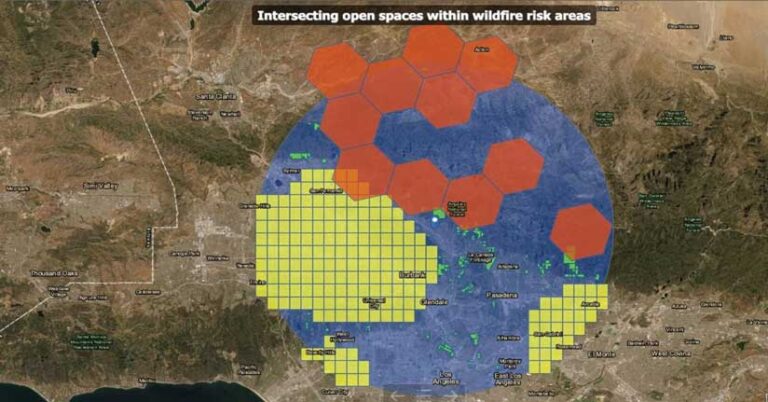
After building the prototype, the students searched for a test site. They performed a site suitability analysis using factors such as land type, locations without drone flight restrictions, and fire risk based on Los Angeles County data. In GIS, they layered the data to identify a high-risk area within a 15-mile radius of their school.
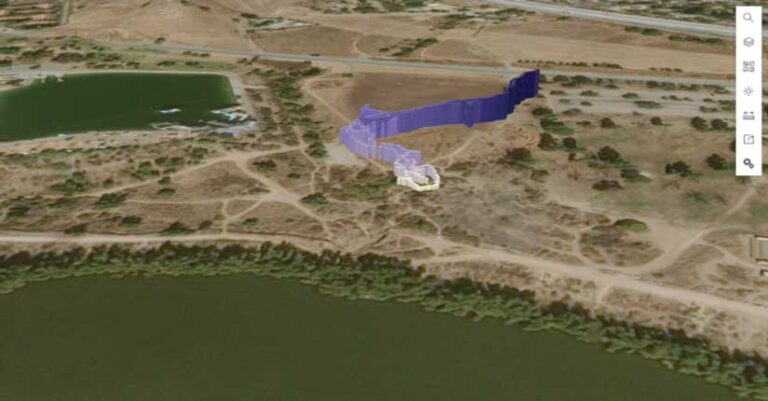
They chose the Hansen Dam Recreation Area as the best place to test their technology. Because of Federal Aviation Administration (FAA) airspace restrictions, students attached their prototype to a tethered weather balloon instead of a drone.
“A wildfire broke out at Hansen Dam halfway through our second flight and proved our fire-risk data was right,” said Keshishian.
A Positive Impact on Careers and Community
The students shared their Hansen Dam Recreation Area web map and ArcGIS StoryMaps story with Fire Captain Steven Marotta of the Los Angeles Fire Department. Marotta noted that dense vegetation makes evacuation efforts challenging and that the students’ map would help emergency responders know where to search.
“This type of intelligence will help us to focus rescues and evacuations,” Marotta said.
The team of students has since graduated, but their teacher Dominique Evans-Bye hopes to see the CTE Mission: CubeSat work continue in future class cohorts and to grow the project’s impact. Evans-Bye said the project could one day include more geospatial technologies, drone imagery, and full motion video captures through a partnership with the Los Angeles Sheriff’s Department and Los Angeles Fire Department.
Anderson W. Clark Magnet High School students received several accolades, including gold placement in the Industrial and Engineering Technology Cluster at the 55th annual SkillsUSA state conference and competition. Judges there noted the students’ technical and workforce-ready skill sets, including hands-on engineering, programming, and mapping.
Evans-Bye agreed, “GIS impacts all industries. It is important to give students hands-on experiences like this where they can show off what they create while also impacting their community.”
The students also had a unique opportunity to present their project to educators and professionals from around the world at the 2022 Esri Education Summit. “These experiences were a great opportunity for us to really revel in the work we’d done and celebrate our achievements,” said student Gabriela Marcucci.
Knowing their work could make a difference made their task more important. “I didn’t just look at textbooks,” said Keshishian. “I can look back at my high school journey and, from this project, say I participated in something that gives back to the community and can save lives.”
Learn more about how GIS helps children turn data into maps, stories, and knowledge and how students can prepare for the workforce by using ArcGIS.