The internet is not up in the clouds but under the oceans.
Ninety-eight percent of the internet runs on cables that stretch across the world’s seabeds.
Submarine Telecoms Forum, Inc. (STF) is the news and research analysis outlet for the submarine fiber communications industry. It publishes magazines, almanacs, and reports about the industry and provides an interactive map of undersea cables. STF has more than 130,000 users in 115 countries.
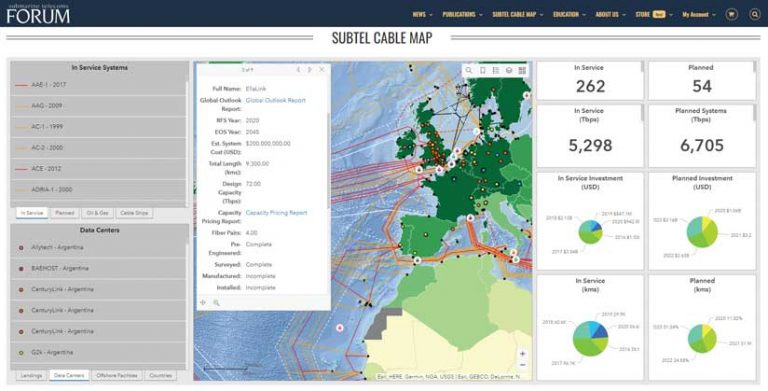
Until STF began publishing its ArcGIS-based Submarine Cables of the World Interactive Map (subtelforum.com/cablemap/) as a companion to the STF Submarine Cable Almanac, the industry did not have access to a comprehensive map depicting important information about submarine cable networks.
This regularly updated interactive map shows submarine fiber-optic cable systems around the world, both current and planned. It also provides details associated with these networks including landing points, data centers, offshore oil and gas systems, and the global cable ship fleet.
“We track the laying of new submarine telecommunications cable and analyze its impact on the industry in general. We are not affiliated with any suppliers, installers, or vendors. We are a neutral third party that provides an unbiased overview of the industry,” said Kieran Clark, lead analyst for STF.
Because the map is interactive, it not only displays an overview of cable networks, but a map user can also drill into a specific area to find information about an individual network on a granular level. For existing networks, that information can include network name, owners, capacity, cable characteristics, and estimated cost. For planned networks, the status of individual networks can be tracked to determine if key milestones have been completed.
STF originally used ArcMap to create the maps that appear in its printed publications but has switched to ArcGIS Pro. Now STF’s publications are delivered digitally and ArcGIS Pro is used for mapping and analysis.
“I am not a GIS analyst by trade, and ArcMap was always a daunting piece of software for me to use,” said Clark. “However, ArcGIS Pro has made the capabilities of GIS much more accessible. We can do more data analysis, and we are making use of web apps and the operational dashboards.”
STF uses a managed crowdsourcing effort for collecting data used in the map. All information and update recommendations are derived from the public domain by a company analyst. Data tables in the Microsoft Azure-based SubTel Forum Cable Database are linked to layers in the interactive map.
“We draw new cables and their landing points for the map in ArcGIS Pro and then connect it to our submarine cable database, which has details on all of the major submarine cables in the world,” said Clark. “We currently have over 500 submarine cables that we track and have data on.”
Lines representing the submarine cables displayed on the map are associated with attribute data about that cable such as the company that installed the cable, built it, how much it cost, its capacity, and many other details. These details are displayed in a pop-up when the line is selected.
Every six hours, STF pulls location data for all cable-laying ships around the world via the Automatic Identification System (AIS) ship tracking service, updating the locations of 46 cable ships. ArcPy scripts are used to automatically update the map. STF has developed an ArcGIS Dashboard around the map that lets users view and filter different datasets available from the map. Cable routes depicted on the STF map do not indicate the actual locations of these networks. Instead, the map lets its viewers easily identify individual cables and their landing points.
A fiber-optic cable is about the size of a garden hose and is placed directly on the ocean floor. Although these cables are strong and much care is taken in laying them, annually approximately 100 submarine cable network faults occur throughout the world. Because cable failures disrupt communications, redundancy is built into networks. The data being transmitted is spread over several cables. Cables laid in the same area take similar routes that are determined by marine surveys to avoid hazardous conditions that might damage cables.
The map also includes more than 1,700 data centers. These data centers aren’t specific to the submarine fiber communications industry, but they are important, so they are included on the map. Data center locations are plotted using addresses and linked to information about each data center. ArcGIS Pro is used to geocode and display all data center locations.
Previously, data centers and submarine cable networks were located somewhat independently. A cable would come ashore at a location that was distant from its data center so it would require hundreds of kilometers of fiber to access the nearest network data center.
Newer data centers are built closer to shore so that submarine cables can quickly connect to the onshore cables and access specified networks more easily. Mapping the proximity of data centers to submarine cable networks can be used to anticipate the need for network expansion. If data centers are located where there aren’t a lot of submarine cables coming on land, this indicates where the cable network could be expanded.
“The information that we disseminate is widely used. People in the submarine cable industry use it when they are looking for information on cables that are currently being laid, cables that are in service, or cables that are planned,” said Clark.
Analysts may want to determine the current status of a specific cable system. The maps STF creates are used for educational purposes by teachers, students, and others to learn about the industry. Companies use the STF website when they want to put together reports about specific cables and make use of the information the company provides.
STF has begun using ArcGIS StoryMaps stories to publish its annual report on the state of the submarine cable industry, a document that is in demand by the industry.
“The report runs more than 100 pages. By including dashboards, we could add some interactive charts and regional overviews. This brings a whole new dimension to publishing,” said Clark. “ArcGIS Pro gives us the tools and flexibility to prepare our technical information in a dynamic manner and present it in a way that is easily understood.”
About the author