At the university level, formal GIS training is often aimed at students who are focused on geographic or environmental studies. Yet interest in spatial thinking is growing in history, language arts, and other humanities, which have not traditionally used GIS.
The best tool for engaging these non-technical users is the Esri Story Maps app, as it provides an approachable and effective introduction to the importance of place. In addition, instructors are drawn to the platform’s narrative qualities and the ability to weave together text, maps, and other media to make content come alive in a shareable digital form.
A team of academic technologists and faculty at the University of Minnesota has sought to implement story maps in courses across the College of Liberal Arts (CLA) and beyond. Since instructors and students in these courses tend to be unfamiliar with digital approaches or have limited time for technical training, traditional GIS training methods simply don’t work for this population.
With the help of an Academic Innovation Grant from CLA, the StoryMaps Curriculum Team has partnered with instructors to design story map-based assignments that quickly teach basic technical skills, demonstrate the spatial power of GIS, and have students walk away with finished digital products. In addition to designing assignments and running in-class workshops, the team designed an ArcGIS Hub site, which contains resources to support instructors and students who undertake story map assignments.
Case Studies from Courses
To begin its initiative, the team conducted one-on-one consultations with instructors who wanted their students to build story maps for some assignments. The challenge was that there is no single way to conduct story map assignments, as each class dealt with a unique topic, required diverse kinds of data, and had very different learning goals.
One course the team worked with was an upper-level history class on early Latin America taught by professor Sarah Chambers, who had the four honors students enrolled in the course. These students completed three story map assignments to replace written ones. In the most fascinating story map assignment, students created a short story map in only a week as part of an in-class group exercise on the early modern Spanish silver trade.
Each student covered a specific aspect of the topic and was assigned a corresponding reading from a course text. From these texts and some additional research, each student identified locations that pertained to their topic and created an ArcGIS Online web map using map notes to sketch relevant points and other features. They wrote short descriptions of their topics and the relevant locations that would serve as text for the story map. In class, students combined the prepared web maps and texts into an Esri Story Maps Journal app and discussed how mapping these locations changed their perspective on each topic.
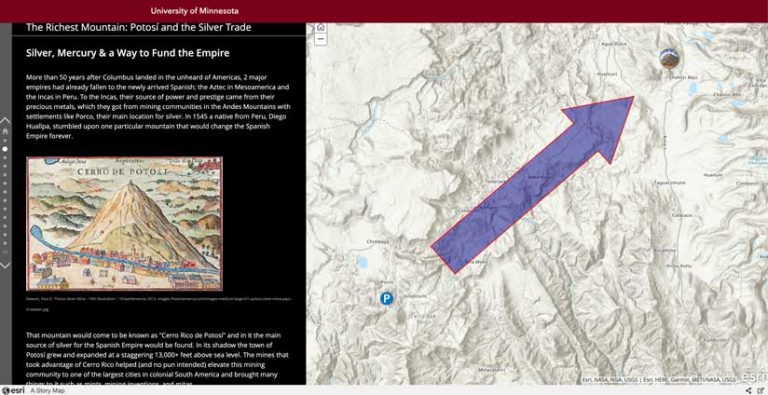
This project was a huge success. Not only did students create a compelling collaborative story map in a single week, they also made fascinating spatial observations in the process. During discussion, one student noted that visualizing the movement of silver made them question their textbook, as the route of the silver supply described by the author did not seem to account for the natural physical barriers, such as mountains and deserts. This demonstrated how visualizing material through basic web mapping has the power to transform one’s historical perspective with a critical spatial lens.
Professor Ann Waltner, another history faculty member who has adopted story maps, built an assignment with the team for her upper-level history methods course. This class used early 20th-century Shanghai as the theme through which to explore different approaches to history, including digital and spatial ones. For their final project, which took place over roughly six weeks, groups of students created story maps focused on different aspects of the city, such as its nightlife, public spaces, and crime.
This assignment was largely exploratory, as the instructor had students map the locations of people, places, and events drawn from original primary sources without knowing exactly what students might find. Through a series of in-class workshops, students learned how to geocode spreadsheet data to turn qualitative textual information into mappable data points. Pinning down locations was no easy task, but they utilized georeferenced historical maps to overcome the confusion caused by changes in the landscape, street names, and address numbering system of Shanghai over the last century. With web maps built, students then created story maps displaying their findings.
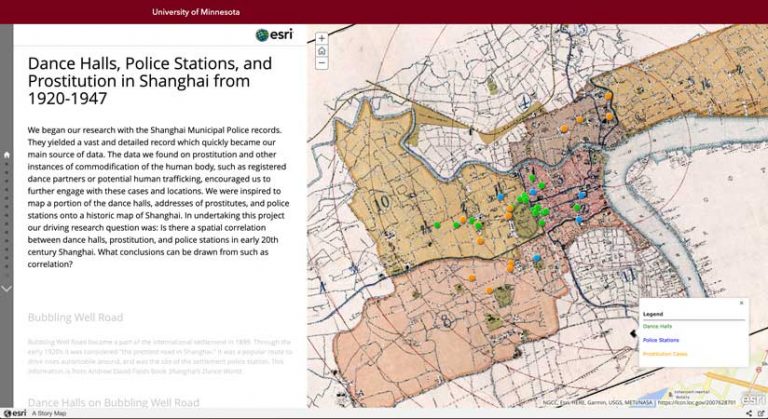
The projects that resulted from the assignment varied widely, but one story map stood out. This project focused on the relationship between Shanghai’s police stations, dance halls, and prostitution activity. The students worked with police records from the 1930s and 1940s, pouring over descriptions of police incidents and painstakingly located where they occurred. Often, they had little to go on beyond vague references to surrounding landmarks. The process of turning these records into spatial data highlighted the immense challenge of visualizing historical locations and events. The value of this assignment came not only from the story maps produced but also in how the mapping process made students think differently about history.
The team also built assignments for an interdisciplinary course on the electric grid system that was cotaught by Jonee Brigham from the Minnesota Design Center and Paul Imbertson, a professor of electrical engineering. Students created story maps as public education projects, which they shared online and presented in a pop-up exhibit at the Bell Museum of Natural History.
This highly structured semester-long group assignment took place in two phases. In the first phase, students created Power History, an Esri Story Maps Journal app about an issue concerning the electric grid in the recent or distant past. This part of the assignment was largely a trial run that gave students an opportunity to learn the ins and outs of story maps and ArcGIS Online. In-class workshops taught them how to geocode spreadsheet data, search for existing data in ArcGIS Living Atlas of the World, and pull multimedia into a story map to create a collaborative digital communication piece.
After this first story map project, students started on their Power Futures projects. These were public education pieces that addressed a present issue facing the electric grid and how to tackle it. Throughout this process, students had frequent in-class group work time, submitted multiple drafts, and received feedback on presentations.
The assignment resulted in well-polished story maps on topics ranging from energy storage to eco-homes. [Eco-homes are designed to be environmentally low impact and have a smaller carbon footprint and lower energy requirements.] Though each project included at least one web map, students tended to deemphasize spatial elements in favor of text, images, and videos that highlighted story maps as a digital communication platform.
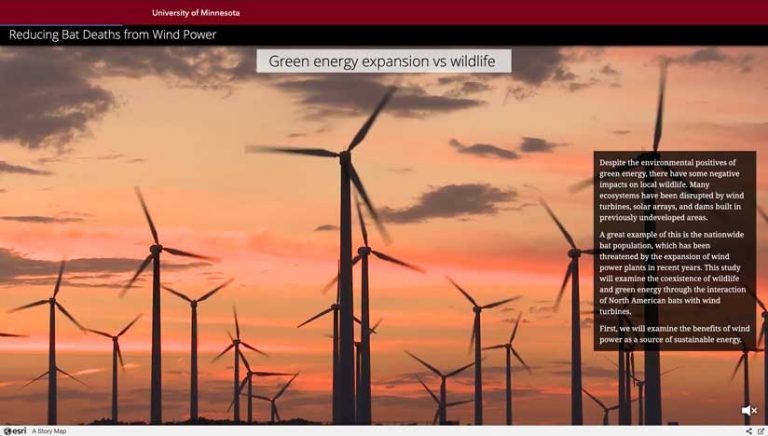
However, a few groups made greater use of mapping. One project addressed the dangers wind turbines pose to bats and other wildlife. With the help of the team, students pulled data on reported bat sightings from iNaturalist. [iNaturalist is an online social network that shares biodiversity information.] Those sightings were linked with a layer depicting wind power installations that had been created by filtering Power Plants in the US, a layer of Energy Information Administration data available from ArcGIS Online. Students created an engaging map. They observed that people tended not to report bat sightings near wind power sites, despite the real threat turbines pose to bat populations.
In addition, the audience at the museum pop-up exhibit was most responsive to projects that had strong spatial elements, like this one. Interactive web maps caught museum goers’ attention more than other multimedia and could communicate information more quickly than by reading the accompanying text. This project showed that—while story maps can be effective for public engagement without maps—they are most successful when students take full advantage of the spatial tools at their disposal.
These case studies are representative of the excellent student work that resulted from the team’s initiative. Each assignment differed in its duration, spatial elements used, and goal and produced many different story maps. Yet across all topics and disciplines, the program gave students the chance to engage with a new spatial mode of critical thinking.
Empowering Future Courses
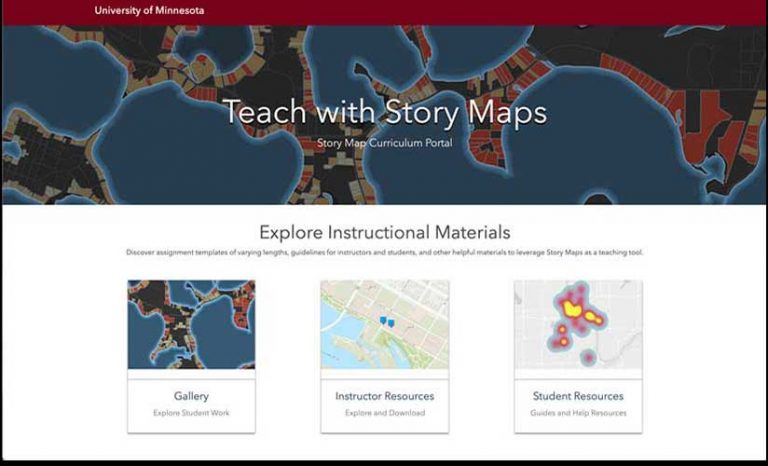
The team’s time in the classroom showed what is necessary to make story map assignments work for any discipline. During this process, the team created a series of resources for instructors and students, which they compiled into an ArcGIS Hub site (storymaps.umn.edu). The site is divided into three sections: a gallery of student work, instructor resources, and student resources.
The instructor resources section assists with every step of teaching with story maps from assignment design to quick how-to tutorials during the story map building process and reviews these resources and how they help make story maps work for instructors and students alike. In addition to materials for designing and implementing a story map assignment, a series of prompt templates and instructor guides are available, sorted by assignment duration and whether they are group or individual assignments.
These templates are based directly on the prompts designed for the courses the team worked with and contain guidance on the framing, scaffolding, grading, and more essential steps for these assignments. This page also provides resources for finding data, sample grading rubrics, and even a set of sample presentations and story maps to be shown in class. These resources are intended to make instructors who are new to GIS as independent as possible when running a story map assignment.
The student resources page provides guidance for students working on projects. It includes material on building ArcGIS Online web maps and creating story maps applications. The page includes links to step-by-step guidelines and best practice references for web maps and story maps.
The team also created a series of short how-to videos focused on tasks that students may need to complete. Whereas many GIS help resources provide extensive detailed guides for each step, these two- to five-minute videos are easily understood by students who are intimidated by the intricacies of GIS.
The gallery of student work, drawn from different courses at the University of Minnesota, complements the instructor and student resource pages. It shows students what a successful story map looks like and shows instructors the type of work students can produce. The story maps discussed previously can be found in the gallery, along with other excellent work.
The team’s initiative is ongoing, and it continues to expand the hub site and reach courses in other disciplines. With the release of ArcGIS StoryMaps, the team will adapt its materials and explore the new opportunities it presents for student work. Story maps are proving to be an excellent platform for instructors to teach both dynamic digital writing and transformative spatial perspectives. With the right guidance, story maps have the power to introduce students to the world of spatial thinking and change how they perceive the role of place in their studies.
For more information, contact University of Minnesota’s U-Spatial mapping center at uspatial@umn.edu.
About the author