Tables are a powerful way to share information in an ArcGIS Pro layout. Table frames in a layout support a lot of formatting options—so many that it can be hard to remember them all. Here are my 10 tricks for tables in layouts. (Just try saying that fast 10 times.)
1. Frames versus Fields
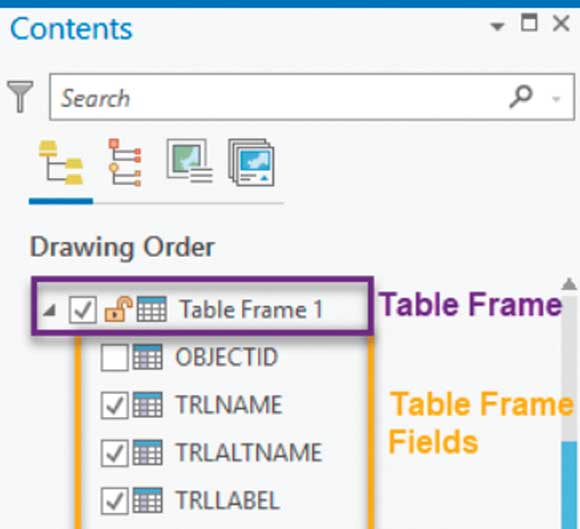
First, it is important to understand the difference between a table frame and table frame fields. The table frame is the layout container for the table data, just as the map frame is the layout container for a map. Table frame fields are individual fields in the table that are displayed as columns.
Some properties belong to the table. For example, controlling whether all the data is displayed or just data visible in the map frame is a property of the table frame. To access the properties for the table frame, select it in the Contents pane, right-click, and choose Properties.
Other properties, such as using word wrapping to determine field width, are set at the field level. By default, all fields in the table frame have the same properties, but you can edit properties for individual fields. For example, you can make the background of the first field blue and make the background for other fields gray. To access the properties for table frame fields, select one or more in the Contents pane, right-click, and choose Properties.
2. Add, Remove, and Reorder Fields
You can add, remove, and reorder fields in the table frame directly from the Contents pane. By default, only the first 10 fields are added to a table frame, so knowing how to add and remove fields is incredibly helpful. Simply right-click the table frame in the Contents pane and choose Add field. To remove a field, expand the table, right-click on the desired field, and choose Remove.
3. Table Striping
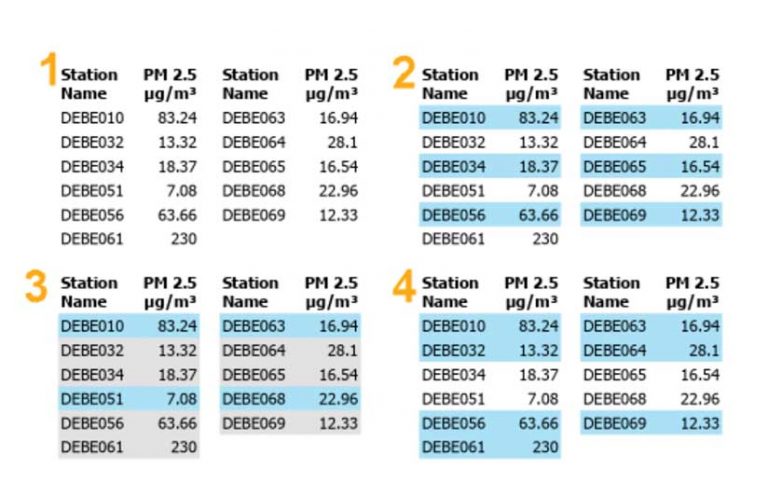
Changing the background for alternating rows can help your table data pop. In the table properties, you can set one or two different row backgrounds and choose how many consecutive rows that background appears on. There are a lot of possible combinations.
4. Number Formatting
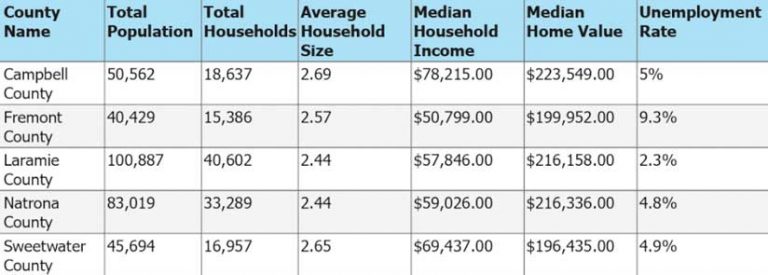
The appearance of numbers in your table reflects the number formatting settings in the table fields view. You can adjust these settings to show numbers as currency, percentages, and other formats. You can also control the number of decimal places displayed and whether a thousands separator is shown.
5. Sorting
You can sort the table based on any field included in the table frame by modifying the table frame formatting. Text fields are sorted alphabetically, and numeric fields are sorted numerically. Date fields are sorted by date. With Custom Sort, multiple fields can be used for sorting.
6. Alignment
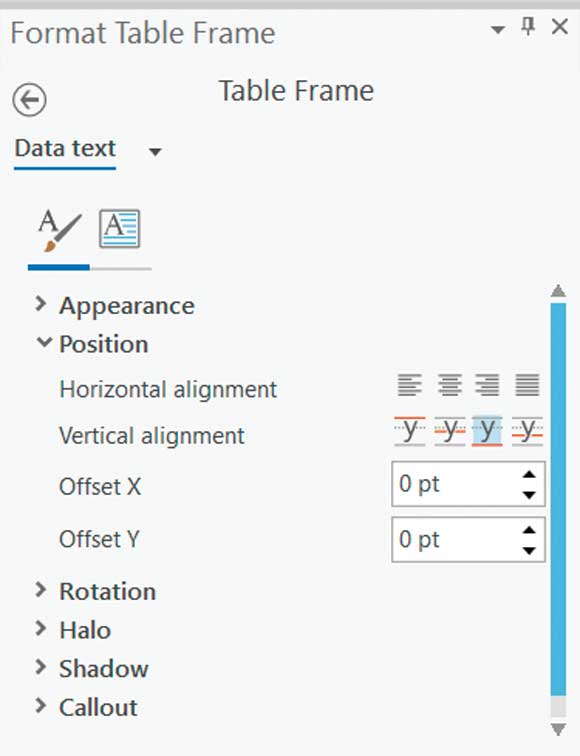
You can set the alignment for individual table frame fields. Sometimes I like to have my text fields aligned to the left and my numeric fields aligned to the right. That can be done by selecting the field you want to align, changing the drop-down to Data text (so that only the field text is modified, not the heading), and setting the alignment.
7. Gaps
Tables will automatically wrap to new columns if the data is too long. You can use other table frame fitting strategies to modify this behavior. You can change the gap between columns. If you want to make your table more compact, try decreasing the gap sizes of other table elements by adjusting the table frame spacing properties.
8. Use Definition Queries
Displaying all the spatial features in a table can take up a lot of space. Consider creating a duplicate invisible layer or a stand-alone table and adding a definition query to display only the most important features in that table.
9. Quickly Update Fonts
There are a lot of ways to set text properties for tables. You can have different text properties for each field if you’d like or just set different properties for headings and text. Or set properties just for one field. You decide. I often find that I just need to quickly update the font or text color for all text in my table, so instead of poking through the pane, I just use the Format tab on the ribbon. Font settings that are updated there will be applied to all the text in the table.
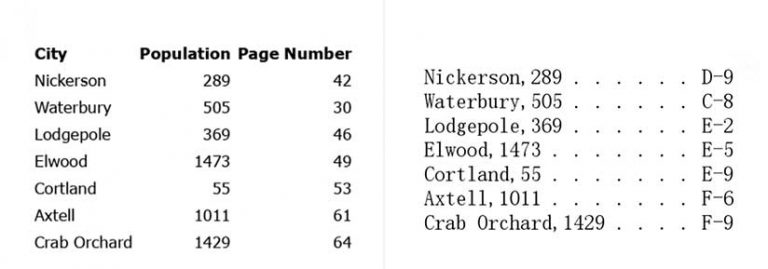
10. Table Frame or Table Dynamic Text
Sometimes, you can’t get a table to look the way you want, or you don’t want to display headings. Consider using table dynamic text instead of a table. Table dynamic text reads values from a table in your map and displays them as text. If those values are updated, the text is automatically updated (that’s why it’s called dynamic). Table dynamic text supports custom queries to determine what data is shown, and it uses ArcGIS Arcade expressions to format the displayed text. If a table just isn’t working, dynamic table text might do the trick. Watch this video to find out more about using table dynamic text.
That’s It
Here you have it: 10 tricks for tables in layouts. Have fun formatting table frames for your next layout. For detailed information on using tables, read the Tables topic in the ArcGIS Pro help documentation at https://bit.ly/3iVlI8F.
About the author