As one of the largest disaster recovery organizations in the world, the American Red Cross responds to an emergency every eight minutes.
From small house fires to multistate natural disasters, the organization partners with hundreds of government authorities to understand where it is needed before dispatching a volunteer army of more than 40,000 to provide affected communities with clean water, safe shelter, and meals.
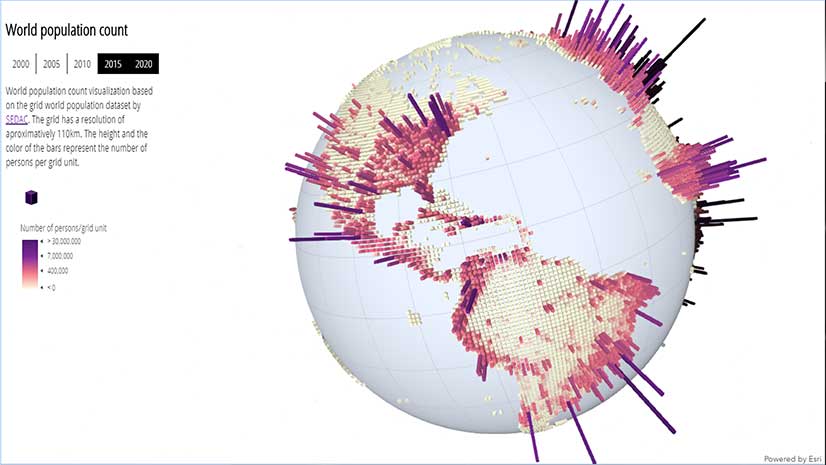
The organization recently completed a digital transformation strategy aimed at optimizing its service delivery. Central to this program was establishing a world-class geospatial solution to guide its operations and generate new efficiencies.
RC View, its award-winning GIS solution, synthesizes thousands of federal, state, and local data sources into one dynamic picture that informs the decisions and actions of its workforce of more than 80,000 as well as an extended network of government agencies and community partners.
The insights derived from this GIS solution are vital during large-scale national disaster relief operations, in everyday response to home fires, and in preparedness efforts for local communities throughout the United States. American Red Cross senior director Brian Keenum gave Mark Wallace of Esri Australia a behind-the-scenes look at the organization’s revolutionary approach to disaster response and recovery.
Mark Wallace: When embarking on your digital transformation strategy, what role did you see for GIS technology at American Red Cross?
Brian Keenum: American Red Cross has been using GIS technology tools to support its operations through creating maps of territories and providing situational awareness for around 20 years, but it was only around three years ago that the organization made a concerted effort to digitally transform its GIS. We set out to create a truly dynamic and modern system that could inform all of operations, by ensuring we were making the right decisions and providing absolute operational transparency to our various stakeholders.
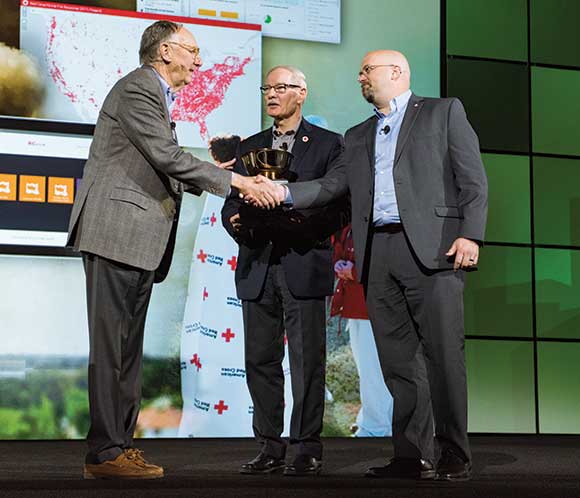
We’ve been successful in achieving that and were humbled to receive the Esri President’s Award from Jack Dangermond [at the 2018 Esri User Conference in San Diego, California]. But it’s not just a testament of the hard work the folks here have done. It’s a reflection of the hard work of our extended network of partners—including government departments, community organizations, and technology providers—who provide us with the additional data, content, and capabilities we need to make a difference.
Wallace: Tell us about your flagship GIS solution, RC View.
Keenum: RC View is an enterprise portal that provides broad access to GIS technology to people across our organization and volunteer network, from directors to operations to volunteers. It is our key platform for managing and analyzing our own data, as well as data from other government agencies like the National Oceanic and Atmospheric Administration [NOAA] and Federal Emergency Management Agency [FEMA].
The insights the technology generates are absolutely critical to our operations on the ground, as well as for our key strategic decision-makers.
We run several programs that are centered around this technology, but from the perspective of a day-to-day basis, we use our GIS solution to provide mapping and analytics capabilities for our service delivery teams. This includes planning and executing service delivery during crises and in response to natural disasters. It’s a critical system for understanding in real time what the potential impact of a crisis may be, who will be affected, how we should respond—and how we can send resources to the right place as quickly and efficiently as possible.
Wallace: How has the technology strengthened your ability to mobilize your workforce during response and recovery?
Keenum: Mobile GIS—and being able to capture and share data and analysis on the fly—has been a very powerful enabler for Red Cross. For example, at our evacuation shelters, we developed a program called RC Collect, which uses Survey123 for ArcGIS, to give our workers the ability to electronically check in people and record their details as they arrive. This feeds into our RC View system so we can record and look back on the data, too. This gives us more visibility as to the demographics of who we are helping and reasons they may be staying at the shelter, and unable to get back to their homes.
This was all paper based previously, so the efficiencies gained have been huge. Also, just having that information available in a dynamic, map-based view makes it easier to connect the dots. For example, if we can clearly see there is a large percentage of elderly people at a shelter, then we may need to organize geriatric services, certain medications, or disability services. If there’s a significant number of kids present who are typically at school or day care, then we need to arrange suitable entertainment and activities for them. The RC Collect app has already been a game changer—and down the track, we’re also investigating extending this capability to enable self check-in.
Wallace: From an efficiency perspective, how has the technology enabled Red Cross to work smarter?
Keenum: We can clearly see it’s taking fewer people to perform our service delivery now we have the right technology in place, and we are reacting a lot more quickly. We also have a detailed understanding of exactly what resources are required to perform a task. This, of course, translates to less wasted time and money because we can deploy the right number of people from the outset, instead of just deploying everyone and realizing later that it was too many people.
The great thing with this technology is we are constantly capturing insights into how we operate to ensure we continually optimize our operations. For example, we are now collecting metrics on how long people may be spending in shelters and making inferences as to why this may be, which helps us determine strategies for getting them back on their feet sooner. These kinds of insights are so valuable—and only made possible by capturing and analyzing this data as we receive it.
Wallace: Aside from response and recovery, how do you use GIS technology for preparedness and mitigation?
Keenum: We have a number of evolving programs in place to support our preparedness activities. For example, there is our home fire campaign, which involves us installing smoke alarms and helping families plan and respond to evacuation alerts.
Our GIS solution provides critical insights into where we need to go to install alarms or run fire safety awareness programs. It does this by capturing and mapping our own home fire data records as to where we have previously installed alarms or responded to an incident, as well as data provided from other fire departments or community groups.
Then we have social vulnerability indexes to identify areas most at risk of fire incidents. By viewing and analyzing this data through a geographic filter, we can clearly understand neighborhoods that require education through awareness campaigns or even door knocking.
Beyond understanding where we need to install smoke alarms, it also helps our disaster action teams respond to every home fire in the US. Where appropriate, we offer financial assistance to folks who can’t be in their homes due to damage and who need help getting back on their feet.
Wallace: You have hundreds of thousands of volunteers and staff to manage—how do you ensure they gain value from your GIS?
Keenum: We have 80,000 people in our core RC View GIS portal and 40,000 disaster relief volunteers who could each potentially access our GIS solution. The challenge is [that] there are different use cases for each of these users. Some people may just use RC View to visualize where key resources are located, whereas others use RC Collect for disaster assessment or shelter registrations.
Therefore, educating our teams and building capacity is a core priority. Increasing user adoption is key to the success of the entire program. We’ve innovated to create this game-changing solution, but now it’s about building our capacity to use the system to its full potential.
To do this, we established the RC View Academy, which is a program with three tiers for learning: beginner, intermediate, and advanced. Beginner [level] is very self-guided, such as educating yourself on how to get into the system and make a map. The intermediate level includes more self-development as well as live online training to take them to the next level on the tools we use. And then there’s advanced, where we train the high performers. This is a lot more hands-on. For example, we recently sent 15 folks to Esri headquarters for an intensive four-day course on Insights for ArcGIS and ArcGIS Pro. Fostering their advanced skills is critical to helping us engage our workforce and build innovation and strength.
Wallace: I understand the next focus for the American Red Cross is making its GIS solution more accessible, not only to its partner agencies and organizations but also to the public. Can you tell us a bit about this initiative?
Keenum: Yes, we’re currently working on a project called American Red Cross Hub, which is all about establishing a two-way communication platform between us and our many stakeholders. It draws on the new capabilities and frameworks Esri has recently launched with ArcGIS Hub to take our foundational GIS work to the broader community, so we can collaborate on projects and amplify the effects of the work we do. It really is the next step in evolving our data-driven decision-making capability to increase readiness and to better meet our mission of alleviating human suffering in the face of emergencies. It’s a way for us to give those incredibly valuable GIS insights and capabilities back to the folks we work with all the time. We know how critical the technology is to supporting our decision-making capability, so we want to ensure others have access to those abilities too.
Wallace: Can you take us through how American Red Cross Hub may be used to improve interoperability between government organizations responding to a crisis?
Keenum: Providing visibility on joint operations is a key element—such as highlighting where Emergency Services Management (ESM) assets are and where are our assets are to give a common operating picture and ensure we don’t duplicate efforts and waste precious time. It incorporates data from not only the fire departments but also our service delivery partners like the Salvation Army. For example, using the map, we can determine where the Salvation Army fixed feeding sites may be so we can determine where to deploy our mobile feeding sites. It really going to be key to optimizing our operations. We also collaborate closely with a number of technology partners, with groups like Noggin, and Esri [is] helping us develop the Disaster Action Team Dispatch system, which manages how people get deployed to an incident.
Wallace: How will the portal be used to keep the public informed?
Keenum: I recently read a statistic from the Pew Research Center that 65 percent of Americans search online for information about their government, but less than 10 percent report finding what they need. When it’s launched in the coming months, the [American Red Cross] Hub will help address this problem and allow us to inform the public and shape our message with them early on in disasters. We need to let the public know what we’re doing in a disaster response as early as possible, and this portal will enable that. Initially, we’ll start out with sharing where the nearest shelter is, evacuation routes, and any other critical other resources that may be required. Then after the storm, it’s about providing updates on our ongoing service delivery—such as listing emergency supplies that have been distributed.
About the author