With the release of ecological coastal units (ECUs), another tool for understanding the Earth is available. Created for mapping and analyzing the world’s coastal regions, ECUs are the most recent development in an ongoing effort to create a global framework for understanding ecosystems on land, ocean, and shoreline that provide the services that support life on earth. GIS plays a vital role in building, visualizing, and using this framework for better understanding ecosystems and preserving them.
Completely mapping the Earth in a standardized and rigorous manner is essential for tackling global challenges, such as climate change and the preservation of biodiversity, which are becoming more pressing concerns. Accurate geospatial information will make it possible for scientists, land managers, conservationists, developers, and the public to understand the current state of ecosystems and contribute to a more profound understanding of how they are changing. This data is vital to identify areas that must be protected and others that need to be managed in a more sustainable fashion.
While an abundance of ecosystem data has been gathered, it has not been available at a global extent that was created with standardized scale and quality. Previously, no organization had undertaken ecological base mapping on a global scale using standardized units and terminology. Without a shared language for reference, it can be difficult or impossible to develop understanding.
The need for the first comprehensive maps that define all of Earth’s ecosystems was recognized and supported by the Group on Earth Observations (GEO), a partnership of more than 100 national governments and more than 100 participating organizations that work to create innovative solutions to global challenges that transcend national boundaries.
GEO BON is GEO’s Biodiversity Observation Network, and GEO Global Ecosystem Initiative (GEO ECO) is an initiative to map and monitor global ecosystems. A high-resolution, standardized, and practical map of global ecosystems for terrestrial, marine, and freshwater environments is an initiative of GEO ECO. Roger Sayre, senior scientist for ecosystems at the US Geological Survey (USGS), was asked to lead the US portion of this initiative and a team that was composed of scientists from USGS and various academic institutions as well as geographers, analysts, cartographers, and software developers from Esri.

Beginning on Land
In 2013, USGS and Esri began this formidable undertaking by mapping ecological land units (ELUs). They built a GIS of world landforms using a 250-by-250-meter grid that contained 3.5 billion cells. A collection of historical maps was used to validate and corroborate this data. The USGS and Esri vetted each of the input datasets, ensuring that each was the best available at the time, and evaluating each for data quality.
More than 105,000 ecological facets describing those cells were identified. These facets represent unique combinations of land cover, lithology, landform type, and climate. The facets were integrated based on different aspects of a terrestrial ecosystems—climate regime, soil moisture, geology, landform, and the organisms present—and aggregated into 4,000 ELUs, using GIS to create a geographic set of ecosystem areas that can be visualized and analyzed. ELUs were first made publicly available in 2015.
ELUs were the beginning of a global framework. They fill the gap between micro and macro views with medium-scale data that is useful for studying ecological diversity, rarity, and evolutionary isolation. Data at this scale is especially valuable for conservation and preservation planning. By establishing common units and shared terminology, ELUs enable greater collaboration.
Mapping of the ELUs was based on structural elements, rather than biological assemblages. Once species distribution data has been incorporated, researchers will be able to explore questions about the carrying capacity of areas. This Esri Story Maps Journal provides more information on the creation and use of ELUs.

A Framework for Understanding Oceans
The work of the initiative moved from Earth’s landmass to its oceans with the development of the ecological marine units (EMUs). As the repository of almost all water on the planet, oceans are critical to the well-being of the planet and its inhabitants because of their impact on climate and weather and their role as a major source of food. Yet, despite this undeniable importance, it is estimated that only 10 percent of oceans have been explored.
To ameliorate this situation, a public-private partnership built the EMUs. The partnership was led by Esri and USGS in collaboration with NatureServe, the Marine Conservation Institute, the University of Auckland (New Zealand), GRID-Arendal (Norway), Duke University, the Woods Hole Oceanographic Institution, the National Institute of Water and Atmospheric Research (NIWA), the United States National Oceanic and Atmospheric Administration (NOAA), and the United States National Aeronautics and Space Administration (NASA).
The project establishes a 3D point mesh framework spanning 52 million points and amassed global measurements of six key variables of the ocean’s water column over a 50-year period. The creation of EMUs was a big data project. EMUs represent data aggregation and computation on an unprecedented scale. Climatology data was extracted at one-quarter degree by one-quarter degree intervals (or approximately 27 kilometers by 27 kilometers as measured at the equator) at variable depths before being spatially analyzed and clustered using a multivariate statistical method and then verified by leading oceanographers.
Released in 2016, EMUs delineate physically and chemically distinct regions of the open ocean and note variations in temperature, salinity, oxygen, and nutrients. They are a standardized, rigorous, and ecologically meaningful set of ocean ecosystem units that may be used as a basemap for climate change impact studies, biodiversity priority setting, economic and social valuation studies, research, and marine spatial planning.
In describing the unique value of EMUs, Esri chief scientist Dawn Wright, who led Esri’s efforts on the project, said, “The strength of EMUs is that they differ from existing maps of marine ecoregions or biogeographic realms by being globally comprehensive, quantitatively data driven, and truly 3D.”
This is data that can help inform the actions of conservation-minded organizations, academic institutions, and scientists, who are working to preserve marine environments. NOAA’s World Ocean Atlas is the primary data source for EMUs. They are easily accessed from Ecological Marine Unit Explorer apps via the web browser and mobile devices and can be downloaded by joining the ArcGIS Online Ecological Marine Units group. This Esri Story Maps Journal provides more information on EMUs.

Between Land and Sea
While the 27 kilometer by 27 kilometer resolution of EMUs is relatively fine for open ocean data, the much higher 1 kilometer resolution was needed for coastal areas. The team that produced the EMUs developed a separate and independent effort to delineate global ECUs in 2018.
This new map covers the unique and extensive coastal region, which differs greatly from terrestrial and open ocean environments. In addition to the coastline itself, the global coastal zone includes the terrestrial ecosystems and marine ecosystems on either side of the coastline.
Understanding coastal zone ecosystems is critical to sustainability efforts and can help mitigate the environmental, economic, and social effects of climate change. Understanding coastal ecosystems is essential for meeting the United Nations (UN) 2030 Agenda for Sustainable Development and its 17 Sustainable Development Goals (SDGs), Specifically, ECUs support SDG 14, Life Below Water goal, which calls for the sustainable management and protection of marine and coastal ecosystems and the conservation of at least 10 percent of coastal and marine areas. Achieving this goal requires a comprehensive inventory of coastal ecosystems and a strategy for determining the 10 percent of ecosystems to be preserved.
According to estimates by the United Nations, nearly 2.4 billion people or about 40 percent of the world’s population currently lives within 100 kilometers of the coast, where they are at risk from flooding caused by sea level rise. Understanding coastal regions will be necessary to limit the social, economic, and environmental costs of sea level rise that analysis has shown will likely to increase within the next decade.

Creating ECUs
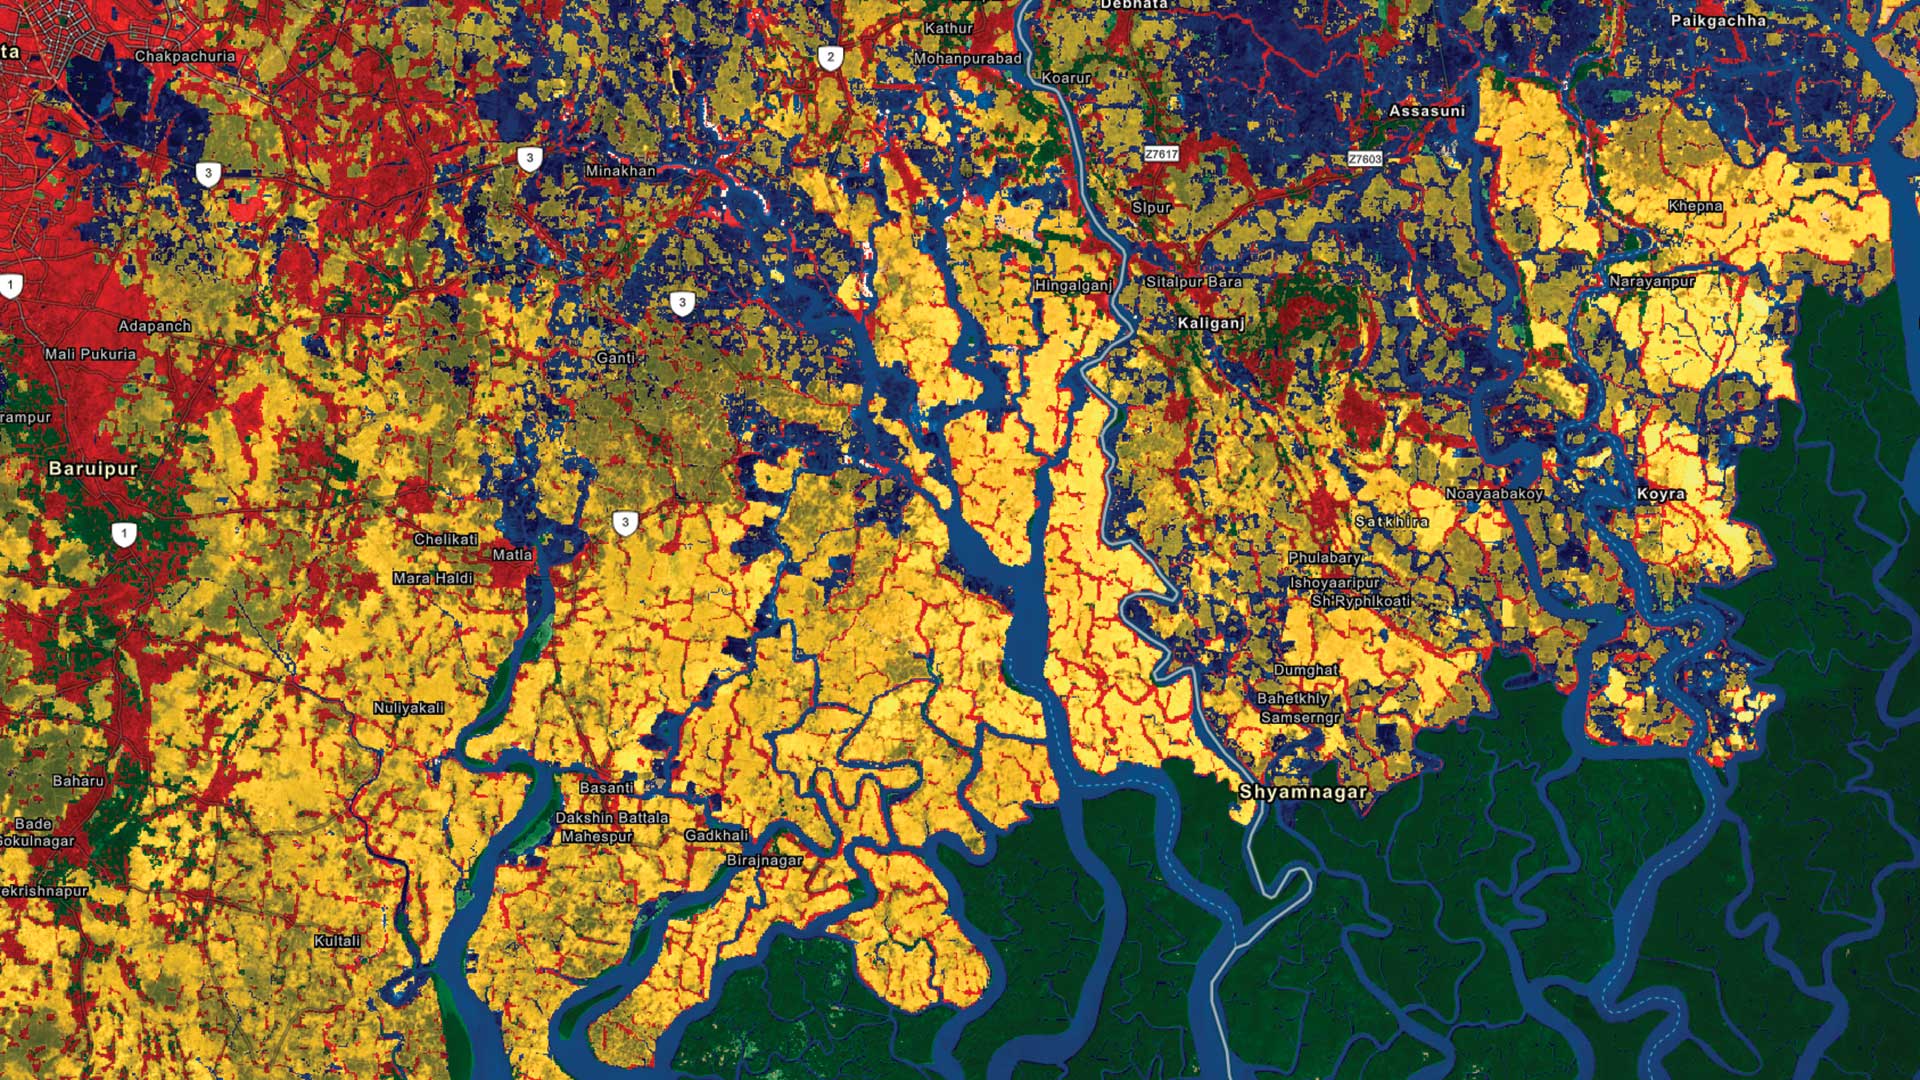
To build ECUs, the team took a coastline segmentation approach in analyzing the differences in coastline properties. The initial step in this process was the development of a brand-new 30-meter resolution image-derived map of Earth’s coastlines. This effort was necessary because the coastline characterization then available was inadequate in terms of accuracy, spatial resolution, comprehensiveness, and the visual fit of the coastline vectors to the shore of existing noncommercial global shoreline datasets.
In a 2019 interview, Sayre said, “We needed a coastline vector as the spatial backbone for this project, so we went into the cloud and extracted a brand-new global shoreline from 2014 Landsat imagery. Looking at this new global shoreline, it occurred to us that since every landmass on the planet is an island, no matter how big it is, we were sitting on a new global islands database.” The 2014 annual composite Landsat imagery was used because it dilutes the effect of clouds in imagery.
The result was the global shoreline vector (GSV) and the global island dataset derived from GSV through the application of polygon topology. GSV was developed using a semiautomated supervised classification approach using big data techniques. Because Landsat imagery was already available in the cloud, the need to house and manage vast amounts of imagery was eliminated.
This process captured data for hundreds of thousands of islands that were missing from previously created datasets. By developing the Global Islands Explorer (GIE), USGS and Esri made this new global data on islands accessible. Using this tool, 340,691 islands can be visualized and queried.
From GSV, four million, 1-kilometer segments were generated. These segments served as the basis for subsequent analysis. Each segment was attributed with 10 variables that described the ecological settings for that segment. Those segments were classified into 81,000 unique coastal segment units (CSUs) based on the Coastal and Marine Ecological Classification Standard (CMECS), a framework for organizing information about coasts and oceans and their associated living systems, which is endorsed by the Federal Geographic Data Committee (FGDC).
CSUs were statistically clustered into 16 groups that are globally similar as described by the 10 variables. This process yielded ECUs, standardized data that facilitates comparison on an apples-to-apples basis and collaboration between organizations.
A Valuable Resource
Although created as inputs for generating ECUs, CSUs are valuable in efforts to understand coastal ecosystems. CSUs provide a descriptive global inventory of coastal ecological settings that have management utility at local scales because they use data at the highest available spatial resolution. ECUs are exploratory and preliminary units that have utility for global assessments, especially for the 30 x 30 goal to preserve 30 percent of land and 30 percent of the oceans as well as the UN SDGs.
ECUs join ELUs and EMUs in supporting the creation of a set of standardized, rigorous, and ecologically meaningful maps. All have been produced using an approach that is objective and repeatable, and uses big data techniques to synthesize and classify ecologically important data layers into distinctive and meaningful georeferenced units.
The next steps in creating this framework for understanding Earth will be the creation of global ecological freshwater units (EFUs) and, possibly, ecological benthic units (EBUs).
These global ecological units are powerful and valuable to a much broader universe. They help promote a more profound understanding of the Earth that has potential for informing more sustainable decisions by governments, the private sector, and nongovernmental organizations.
About the author